NOAA’s Environmental Literacy Program (ELP) provides competitive grants and in-kind support for formal (K-12) and informal education projects to increase local resilience to hazardous weather, changes in the climate, and other environmental threats monitored by NOAA. All projects are in service of NOAA’s mission of science, service, and stewardship.
Using NOAA’s resources, funded projects provide opportunities for people to:
- Reason about the ways that human and natural systems interact globally and locally;
- Participate in civic processes; and
- Incorporate scientific data, cultural insights, and the diverse values of various communities when initiating actions to anticipate, prepare for, respond to, and recover from environmental threats.
The program's Theory of Change articulates the outcomes that are sought and being achieved through these investments. Summative evaluation reports and links to project summaries are available for more information about completed projects.
2023 Impacts
-
More than 3,000 formal and informal educators participated in ongoing professional learning communities designed to empower each educator with the confidence and competence to teach NOAA-related topics and use NOAA’s assets to educate others.
- More than 6,000 K-12 students participated in formal education projects.
- More than 12,000 children, youth, and adults participated in informal education projects.
Statistics on resilience education awards
Since the program's inception in 2005, it has supported education initiatives that serve NOAA’s mission of science, service, and stewardship. In 2009, the program began focusing on building the climate literacy of children, youth, and adults. Over the next five years, the climate education community started to recognize that increasing awareness of climate variations and understanding of their causes were not sufficient to motivate audiences to take action to mitigate and adapt to their effects. By 2015, the program's focus shifted from funding climate literacy-focused projects to resilience education projects. These approaches are solutions-oriented and locally focused. Further, the program concentrates on projects that engage, educate, and empower participants to act individually and collectively.
The response to resilience education competitions was large. To date, the program has received 849 applications — spanning all 50 states and U.S. territories — with a total federal funding request exceeding $385 million. The magnitude of this response underscores the nation’s demand for education as a means to help build local resilience to the environmental threats monitored by NOAA. However, it also means the program’s competitions have been highly competitive, with about 6% of the applications funded. To date, 47 grants have been awarded, totaling approximately $22 million.
Due to the high demand for resilience education, a previous competition in 2020 solicited projects only from the Southern and Western regions of the country. The 2022 competition continued this geographically restricted approach, soliciting projects only from the Central and Eastern regions. There was also a solicitation open to awardees from projects funded between 2015 and 2018.
Application, awards, and success rates
The bar chart below illustrates the number of applications and awards for each fiscal year from 2015 to 2022, along with the success rate for each year. On average, the program receives about 170 applications per fiscal year and funds approximately nine, resulting in a success rate of about 5%.

Resilience education grants
The bar chart below illustrates the number of new and continuing resilience education grants by fiscal year from 2016 to 2024. The chart shows an average support of at least 15 resilience education projects per fiscal year. For fiscal year 2024, it displays the total number of new and ongoing grants.

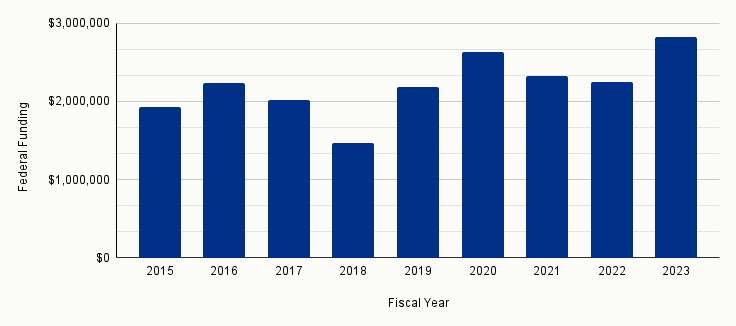
The bar chart below illustrates the total amount of funding allocated to active recipients for resilience education for each fiscal year from 2015 to 2022. On average, these recipients received over $2 million in funding per fiscal year. The peak funding occurred in 2023, whereas the minimum was in 2018. It is important to note that the term "fiscal year" refers to the period when Congress allocates funding.
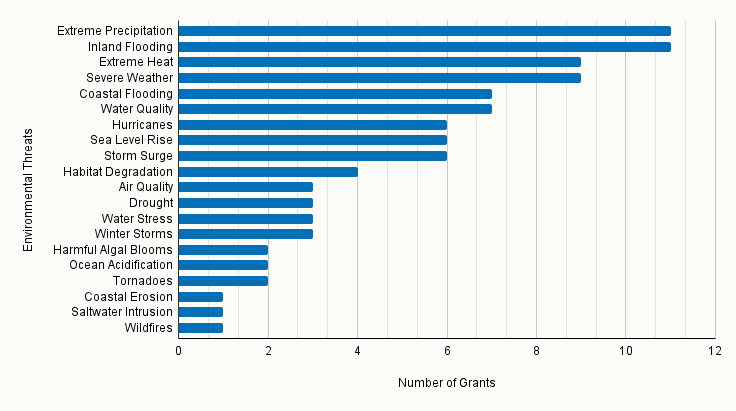
The bar chart below illustrates the environmental threats addressed by resilience education recipients in fiscal year 2023. A majority of the recipients responded to several threats concurrently. The most commonly addressed threats included extreme heat events, extreme precipitation, and flooding.
Resilience education grants and their geographic impact
To date, the program's resilience education grant projects have served thousands of children, youth, and adults from 40 states, the District of Columbia, and the U.S. Virgin Islands — including 241 counties. They have supported educational efforts to enhance participants' environmental literacy, equipping them with the knowledge, skills, and confidence to aid their communities in becoming resilient to the environmental threats monitored by NOAA.
Planting resilience: Environmental education in action
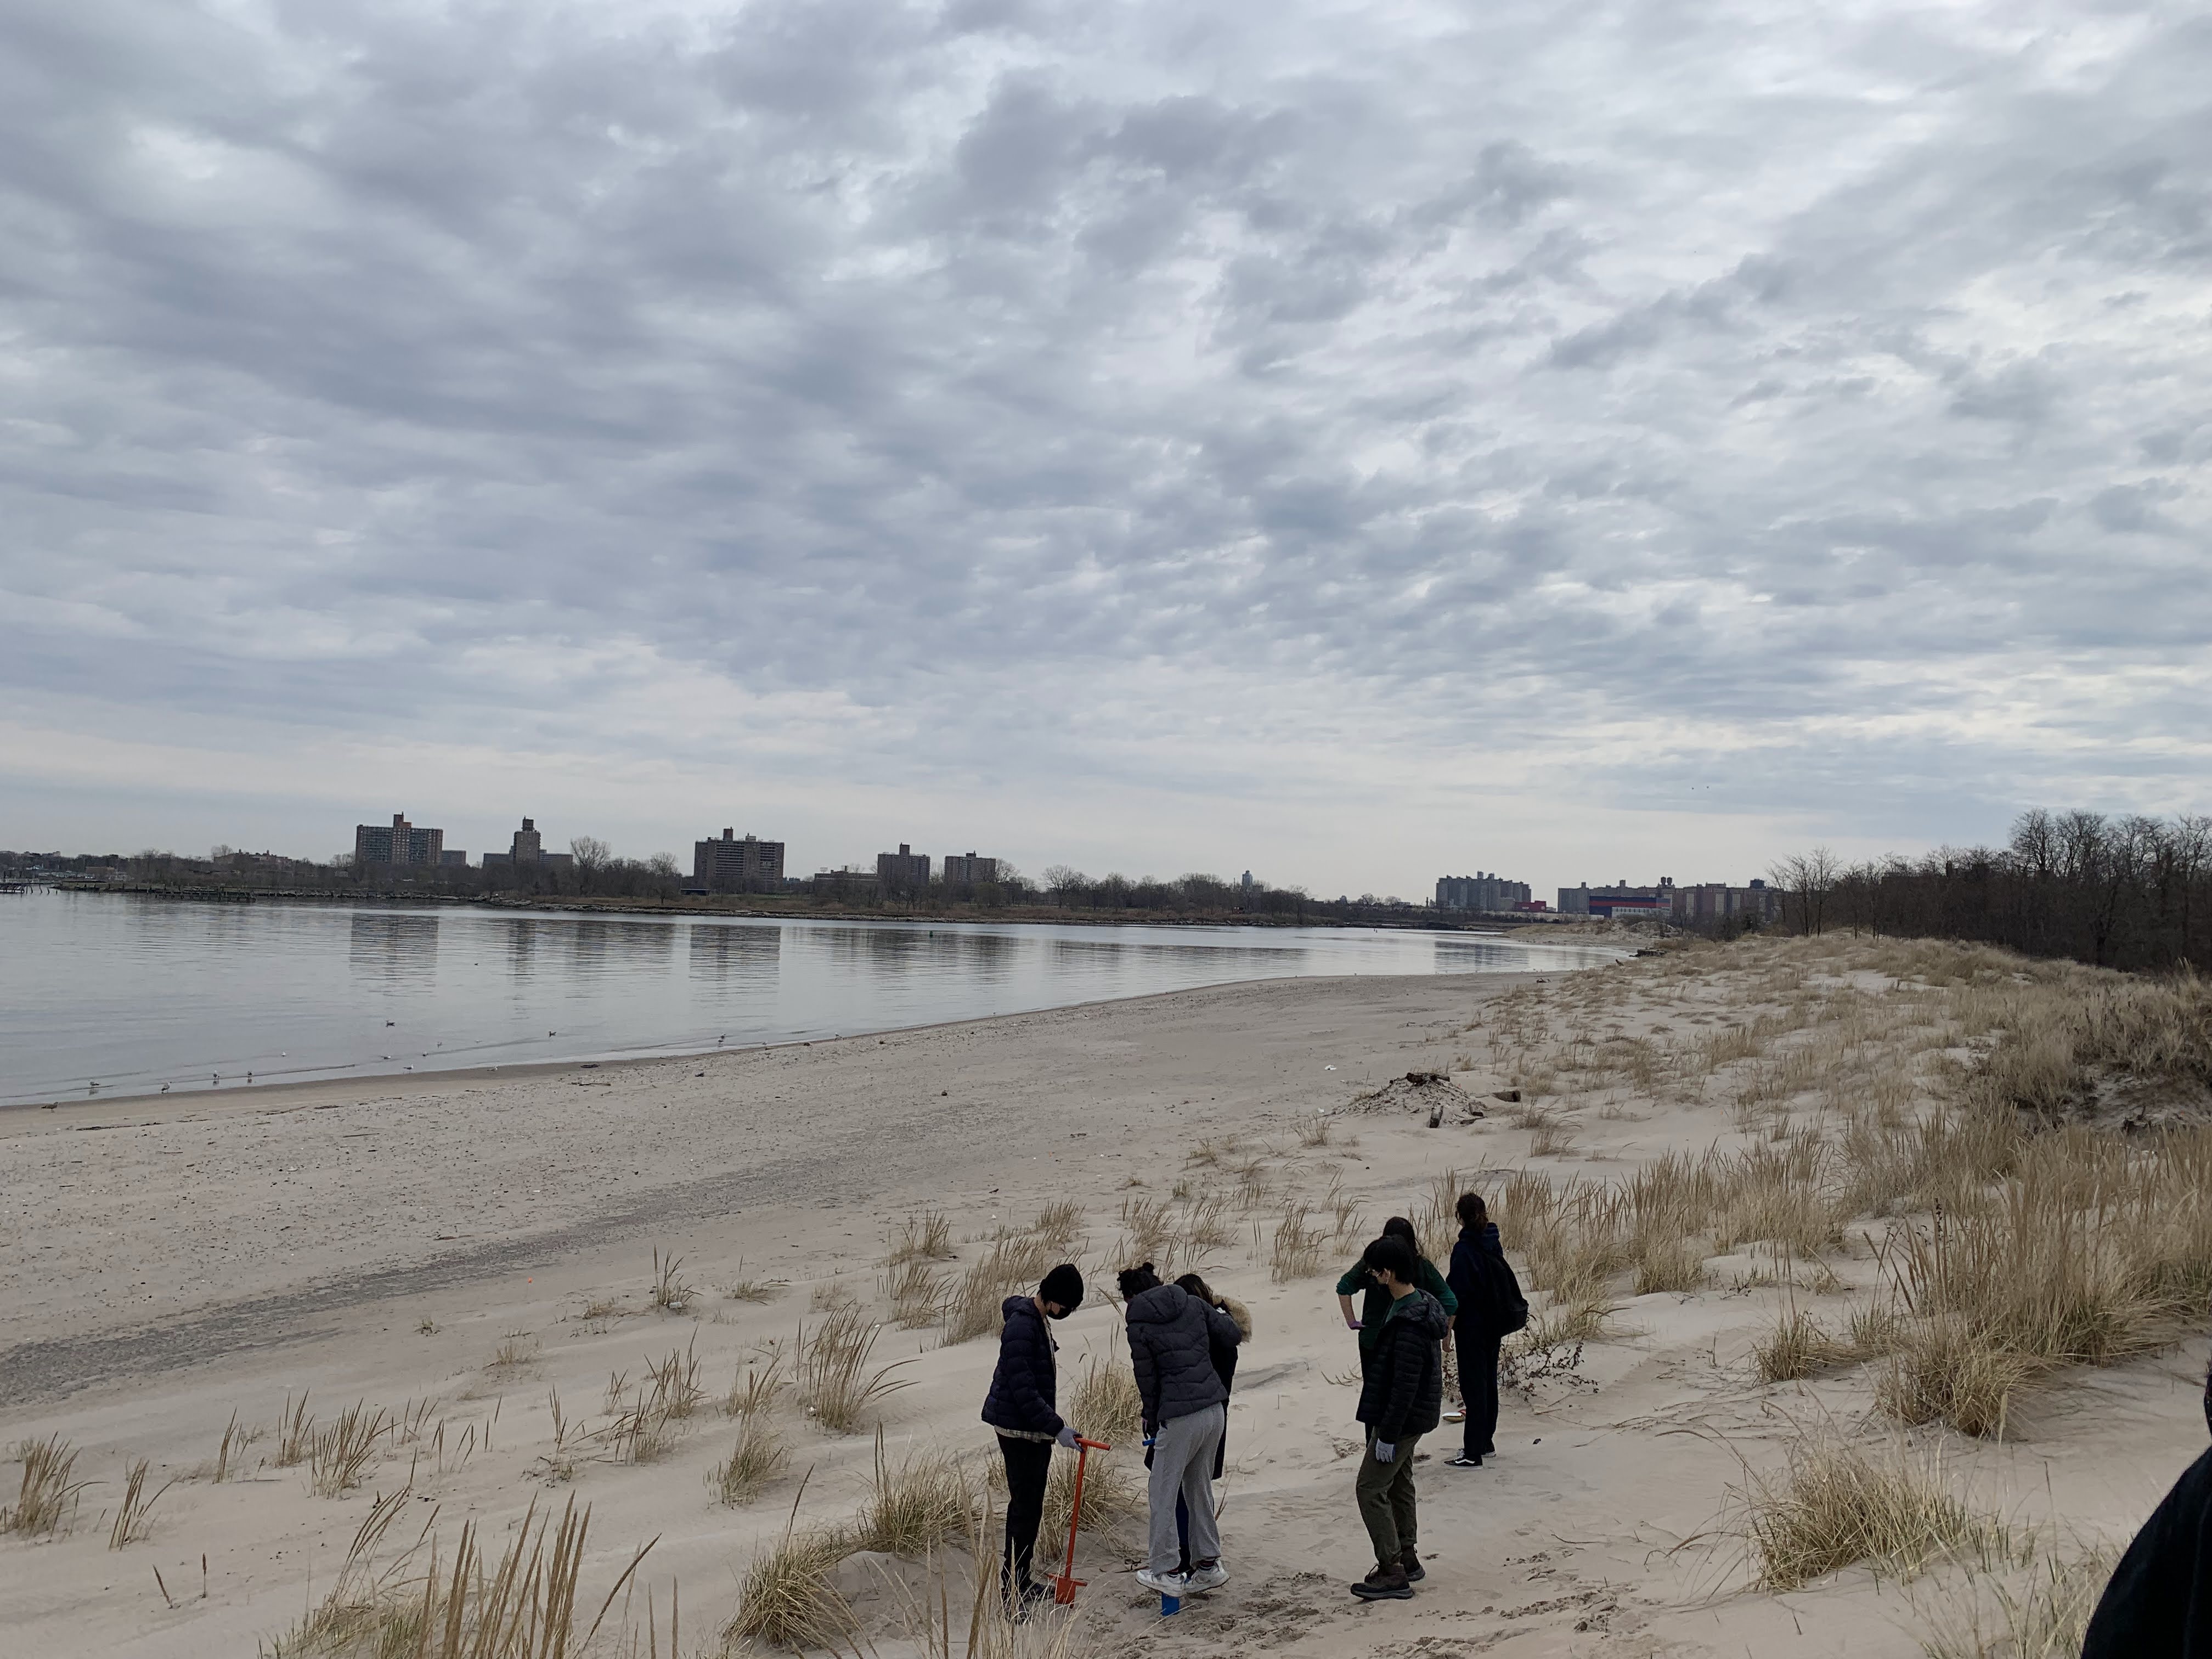
In early 2023, the Resilient Schools Consortium (RiSC) Phase II project, led by NYC Eco-Schools, led educational activities at Coney Island Creek Park in Kings County, New York. More than 100 high school students from seven Title I schools participated and focused on building environmental resilience. The main activity involved planting 15,600 dune grass culms to improve the ecological health and stability of the sand dunes along the Coney Island shoreline. By stabilizing these dunes, the project aims to protect nearby homes and infrastructure from increasing threats of coastal erosion and flooding exacerbated by sea level rise.
The project extended beyond its physical impact on the environment, also functioning as an educational opportunity. Students participated in a field trip to Coney Island, where they actively explored the local ecology and the wider effects of climate change. This hands-on experience offered them practical insights into environmental issues, facilitated through recording observations and engaging in collaborative activities.
The educational aspect of the project was deepened through focused studies in two areas. One group of students collaborated with the American Littoral Society to investigate marine life in Coney Island Creek. Another group, under the direction of Katie Graziano from New York Sea Grant, focused on coastal features. They delved into issues such as sea level rise, erosion, and their effects on both human and wildlife communities. Using NOAA data, they created signage to show areas that will be impacted by projected sea level rise.
Huffman Studio, Inc., documented these activities, conducting interviews and capturing key moments of the project. This footage became part of the sequel to the RiSC documentary, "It's Our Future." The documentary aimed to provide a comprehensive view of the student's experiences and insights gained during their involvement in this environmental project.
Statistics on all awards
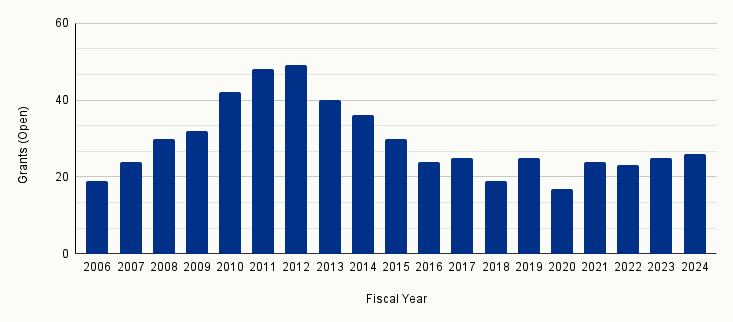
The bar chart below shows the number of new and continuing grants by fiscal year from 2005 to 2024. The chart reveals that, on average, the program has supported at least 26 active grants per fiscal year. In total, the program has awarded 163 grants to 111 institutions nationwide for a total of $94,682,612 in federal funding.
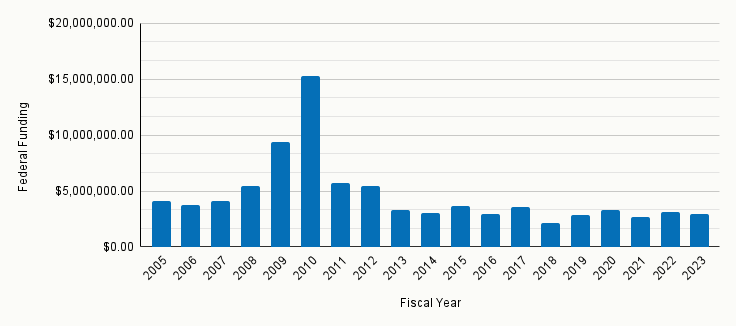
The bar chart below shows the amount of federal funding received by active recipients during each fiscal year from 2005 to 2023. On average, these recipients received around $5 million per fiscal year. The highest amount of funding was provided in 2010, while the lowest amount was in 2018. It is important to note that the fiscal year refers to the period in which funding was allocated by Congress.
