An official website of the United States government
Official websites use .gov
A .gov
website belongs to an official government organization in the United States.
Secure .gov websites use HTTPS
A lock (
) or https:// means you’ve safely connected to the .gov website. Share sensitive information only on official, secure websites..
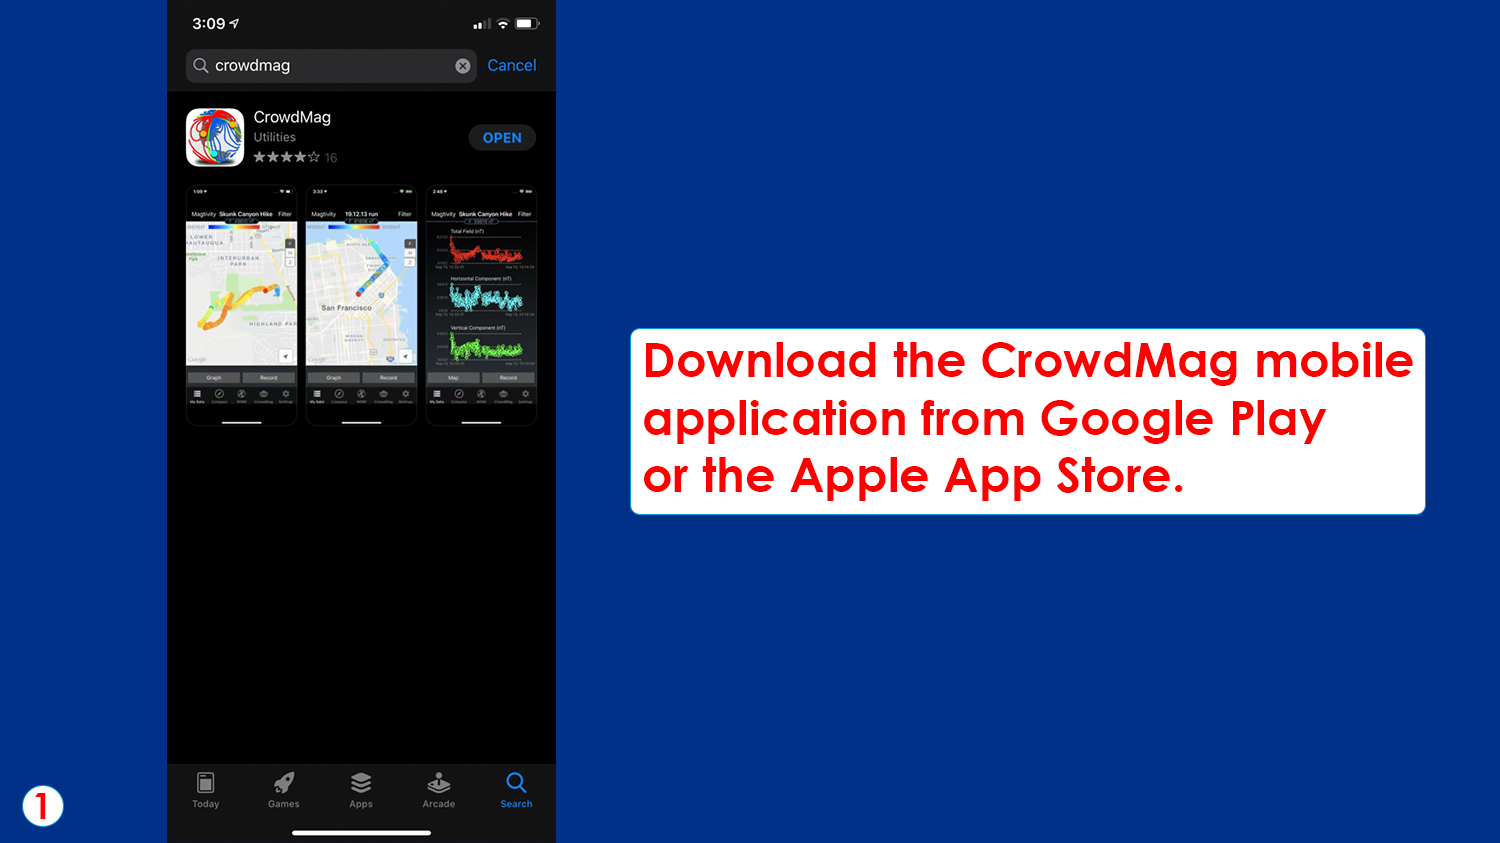
CrowdMag is a citizen science project that uses your mobile phone's internal magnetometer to record magnetic fields as you move around outside. The CrowdMag app now has a flight mode where you can collect magnetic data while you fly. Airplane observations fill in a large gap in magnetic data. Satellites can capture the biggest shapes of the magnetic field, and ground based observations can capture the smallest, but scientists aren’t able to capture observations between those extremes without airplanes. Help contribute to this project the next time you fly!
To use CrowdMag in your neighborhood, check out our original CrowdMag tiny tutorial! Learn more about Earth's magnetic fields from the NOAA Geomagnetism group.
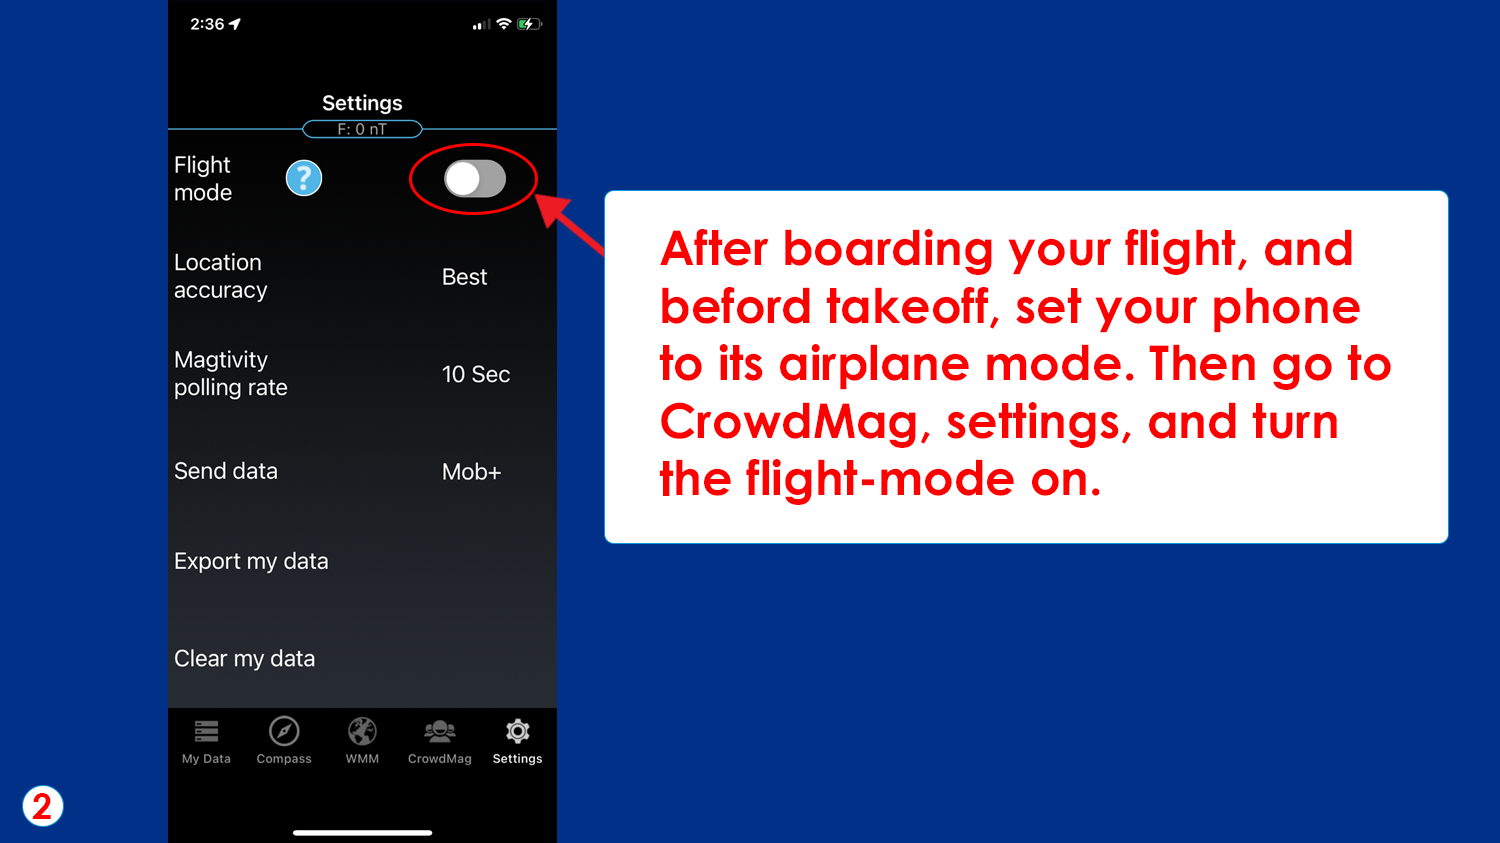
Step 2: After boarding your flight, and before the takeoff, set your phone to its airplane mode. Then go to CrowdMag, settings and turn the flight-mode on.
(Image credit: NCEI/NOAA Education)
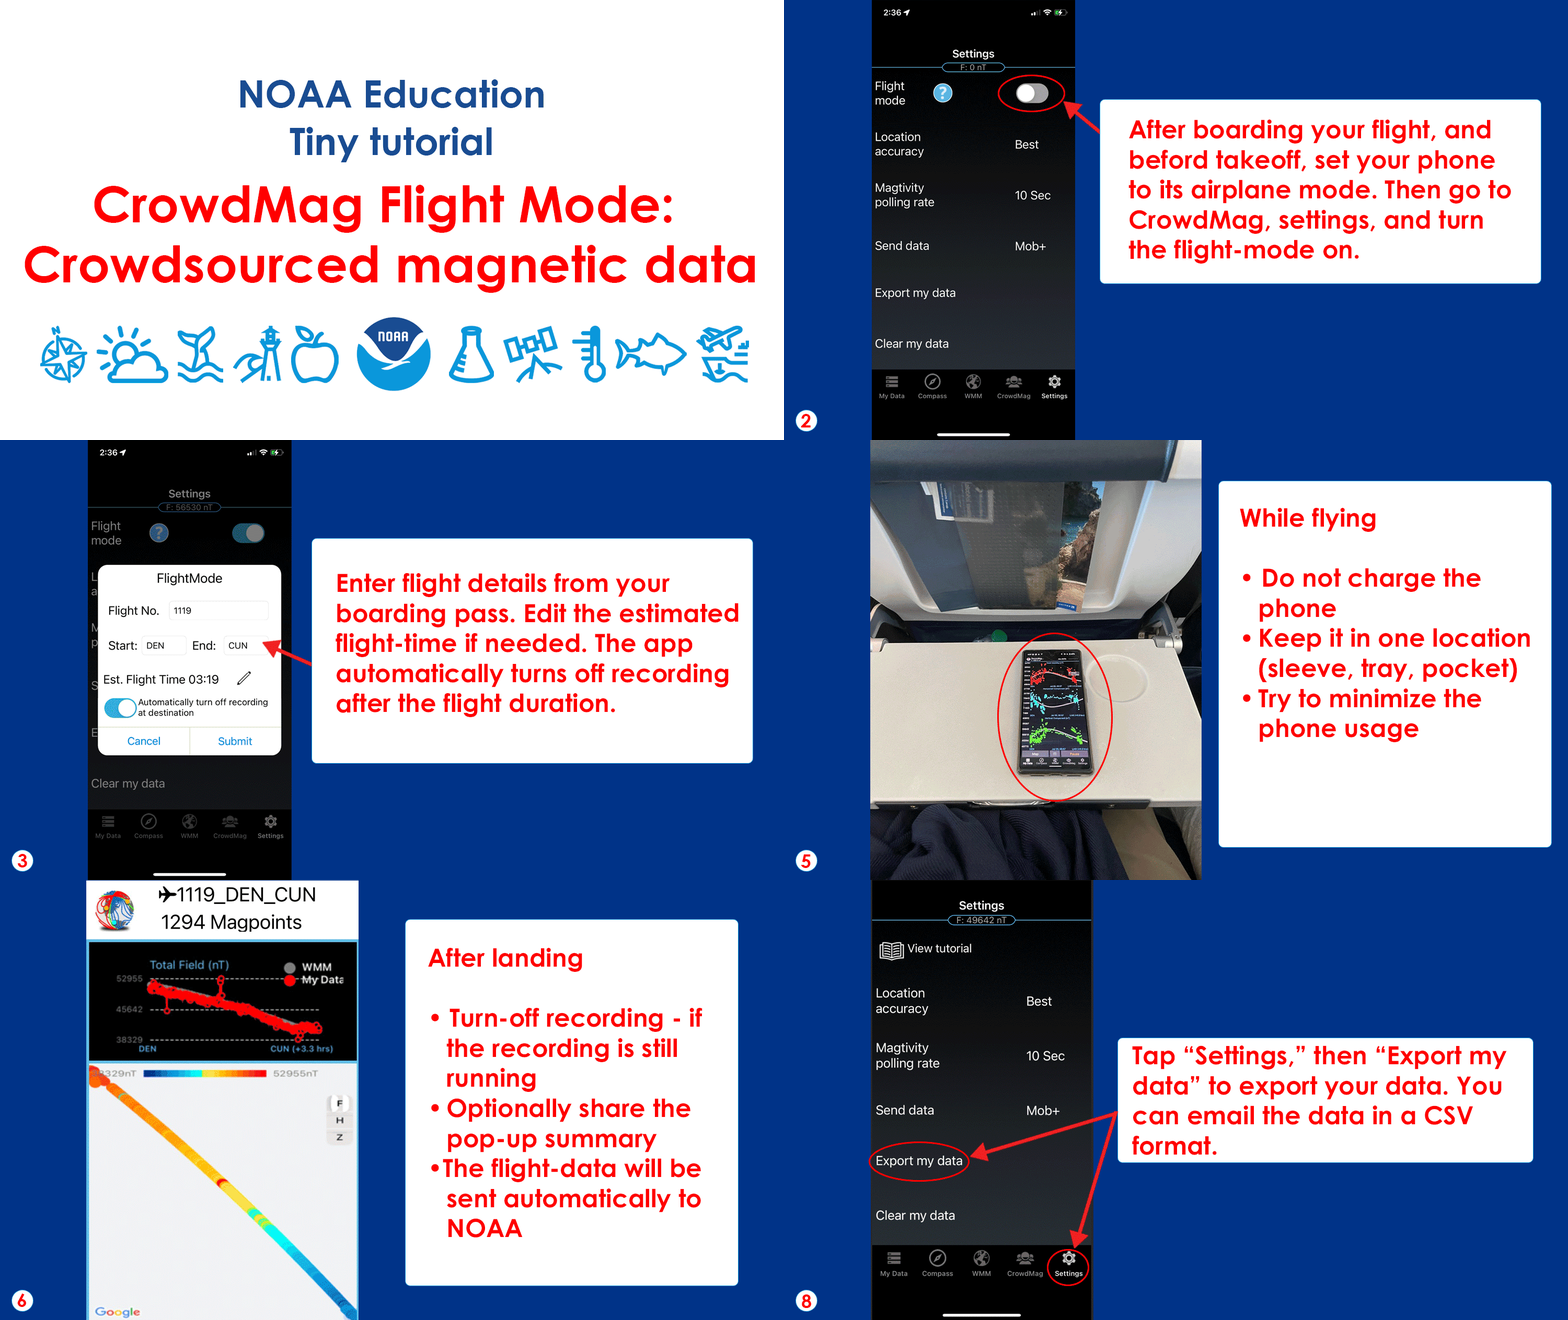
Step 3: Enter the flight details (three-letters codes for start and end airports and flight number) in the pop-up menu. The app provides an estimate of the flight duration based on the great circle distance and average flight speed. The app doesn’t know about weather conditions, such as the current position of the jet stream, so it is a good idea to check your actual estimated flight time and update it in the app. Tap submit.
(Image credit: NCEI/NOAA Education)
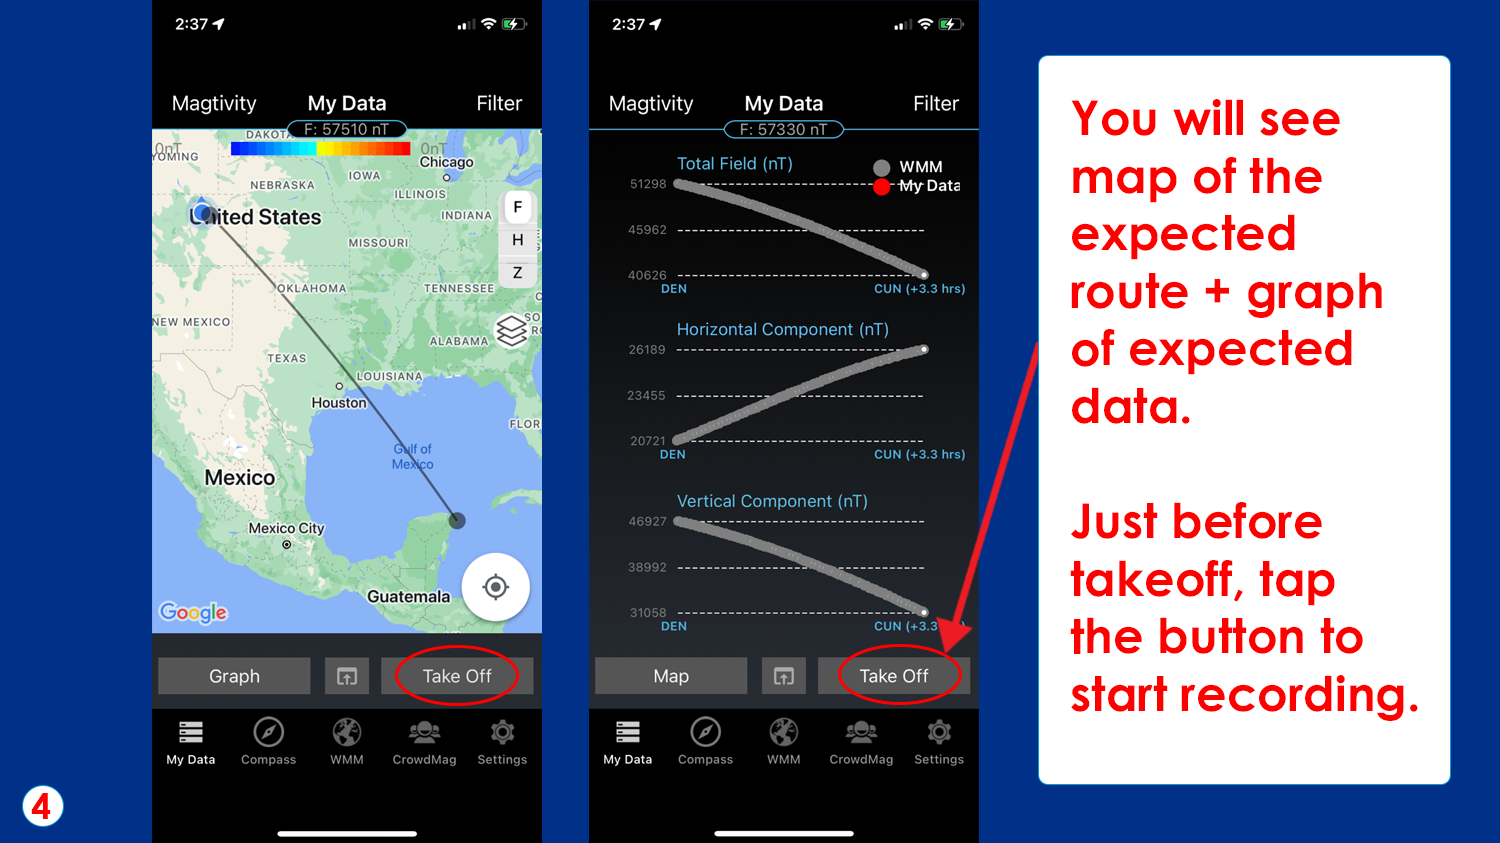
Step 4: You will see a map of the expected route and tap “graph” to see the expected magnetic field variations along your route. You have not yet started recording. When the flight is taxiing for takeoff, tap the “Take Off” button to start recording. (Image credit: NCEI/NOAA Education)
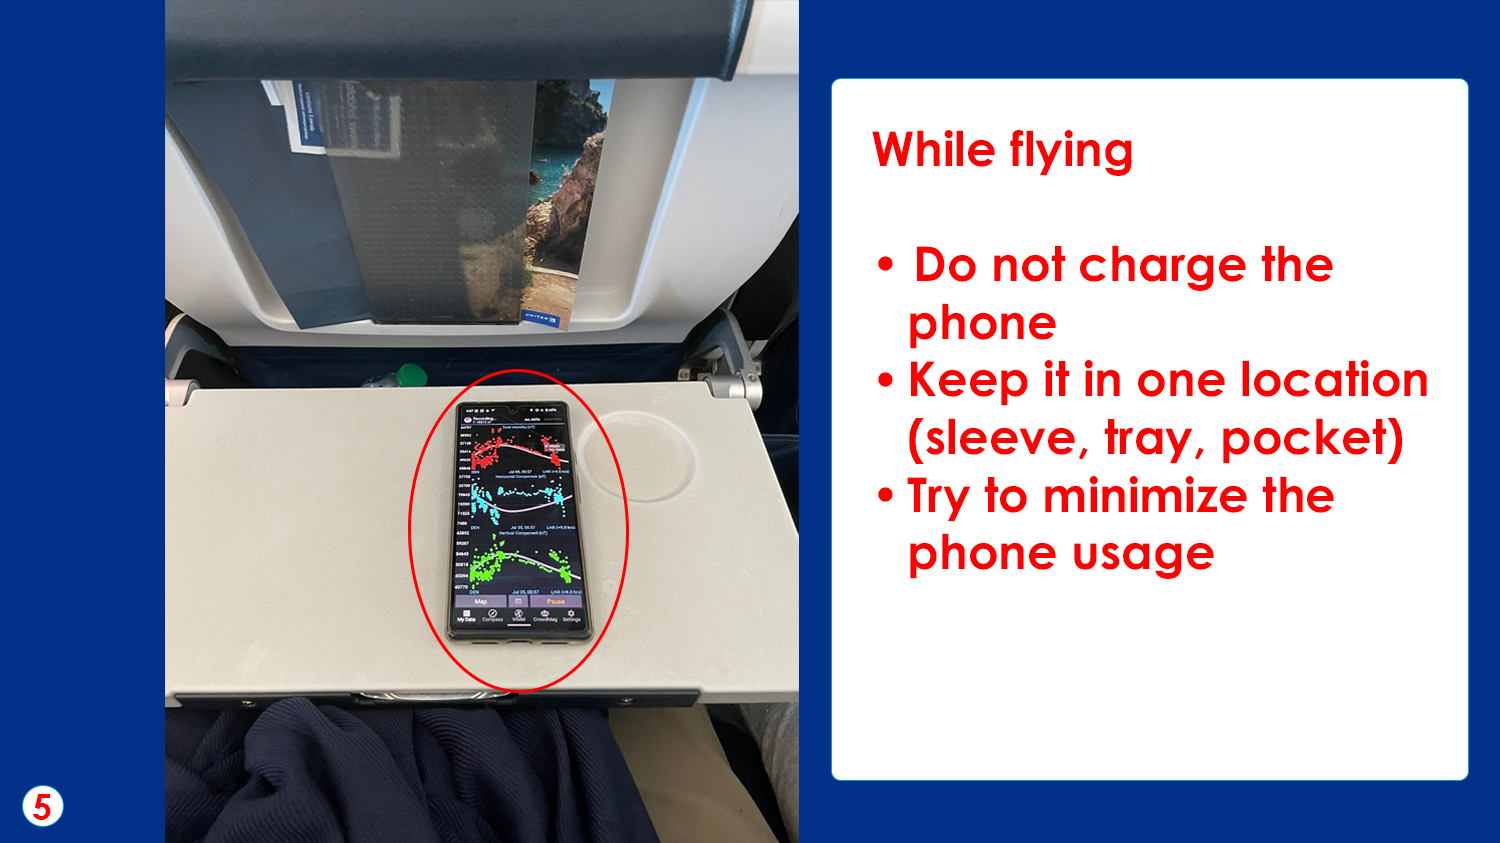
Step 5: While flying, keep the phone in the same location, if possible. We have had the best results when keeping it in a shirt pocket or in your stowed carry-on bag away from any metal objects. You can also try placing it in the seatback pocket in front of you (but don’t forget to collect it at the end of the flight!) or on your tray table. Do not charge the phone. Try to minimize the usage if you can.
(Image credit: NCEI/NOAA Education)
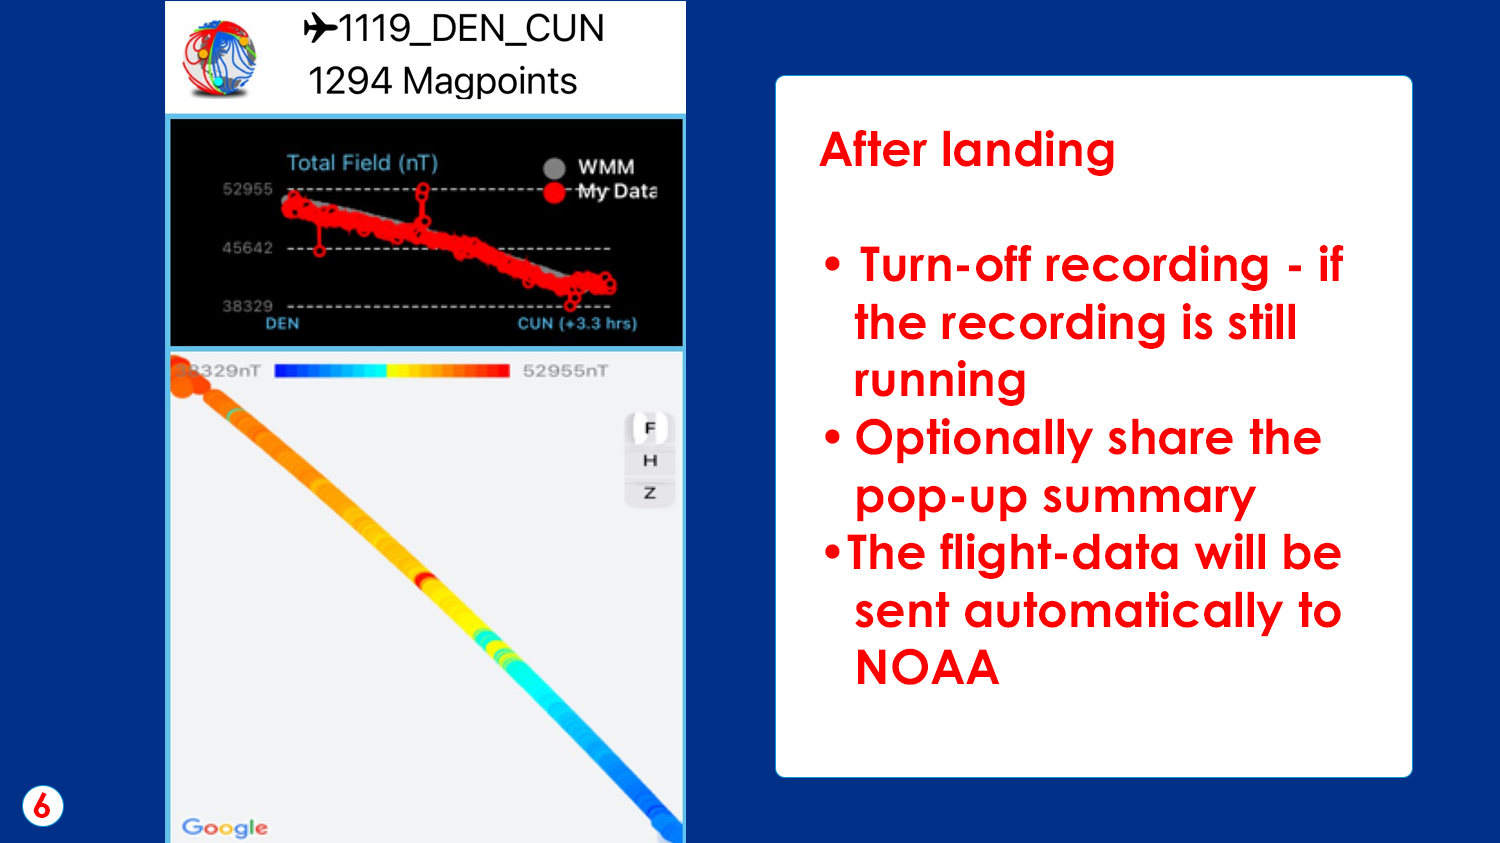
Step 6: After landing, turn off the recording if the app hasn’t done that already. Optionally share the pop-up summary of measurements. The data will be automatically sent to NOAA to help with their science.
(Image credit: NCEI/NOAA Education)
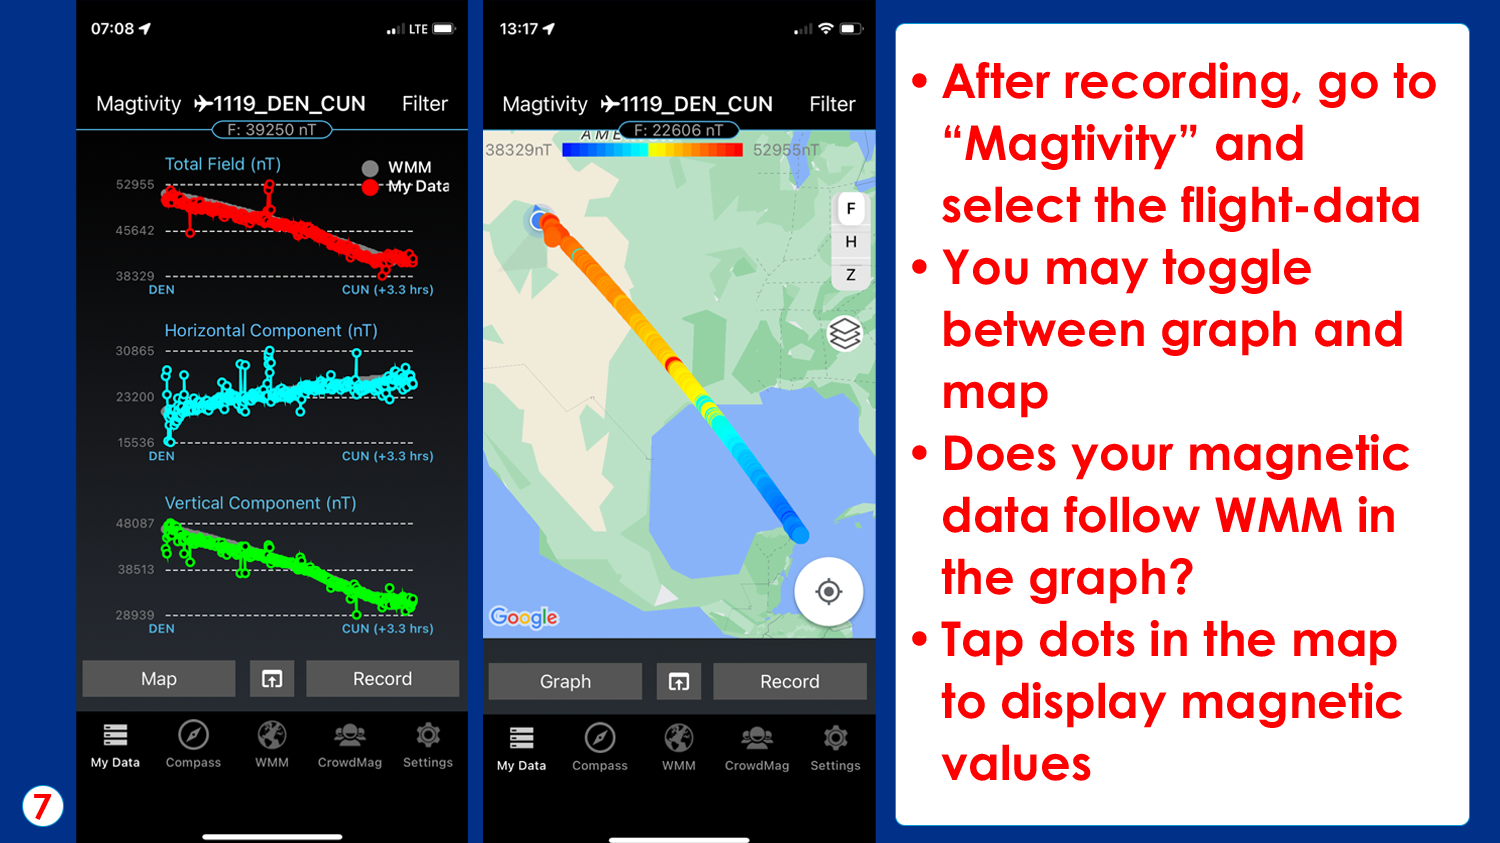
Step 7: After recording, go to “Magtivity” and select the flight-data. On the map, tap each dot to see the magnetic data. Blue dots indicate areas with a lower magnetic field value. Red dots indicate a higher magnetic field value. On the graph, the gray line shows the expected magnetic values. Does your magnetic data follow the WMM? This example shows data we collected on a flight from Denver (DEN) to Cancun, Mexico (CUN). The overall trend of the data is a good match to the predicted magnetic field based on satellite data models. About mid-way through the flight there is a big “glitch” in the data - this happened when we got up out of our seat for a few minutes.
(Image credit: NCEI/NOAA Education)
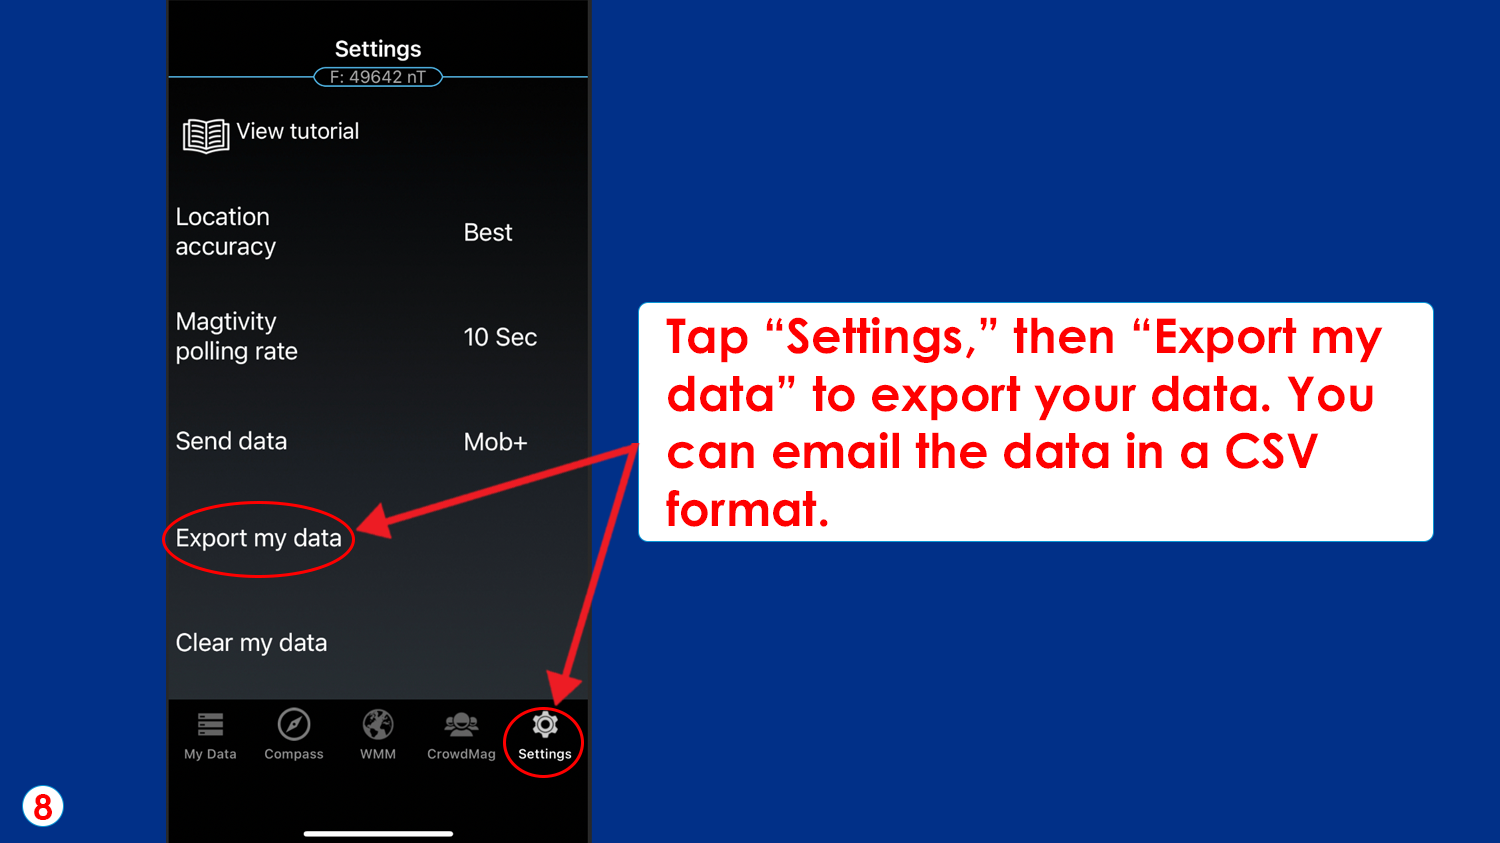
Step 8 (optional): Tap “Settings,” then “Export my data” to export your data. You can email the data in a CSV format. You might want to email it to yourself or a friend so you can analyze it yourself (for example, read it into Microsoft Excel or Google Sheets).
(Image credit: NCEI/NOAA Education)