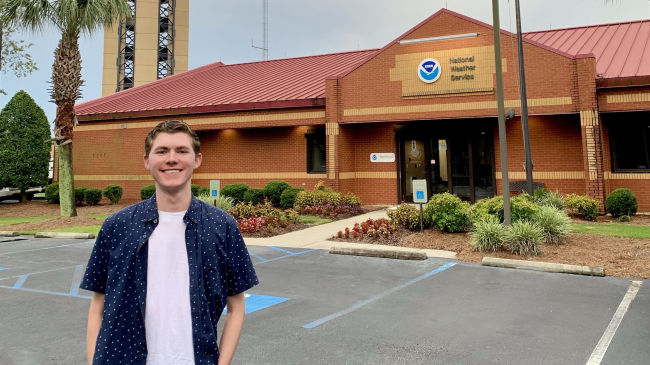
Working with the National Centers for Environmental Information, Lauren Janicke, a 2021 Hollings scholar, compared methods for creating maps of plant hardiness zones in the United States.

2021 Hollings scholar Lauren Janicke. (Image credit: Courtesy of Lauren Janicke)
If you’ve ever planted a garden, you may have noticed tags that indicate a plant’s “zone.” These plant hardiness zones help predict what plant species will survive the winter in a given area, and they are based on the average annual minimum temperature over 30 years. Lauren was excited to apply skills that she gained from her civil engineering and statistics majors this summer. Making these maps involved finding a few pieces of information for the area of interest: the yearly minimum temperatures and the 30 year average of the minimum temperatures. Lauren gathered temperature data from weather stations and then interpolated, or estimated, the temperatures across the region using the data.
The Hollings program made me all the more confident in my existing skill set in data analysis for environmental problems while building upon it.
The order in which this process of interpolation is done can affect the resulting map. Better understanding the effect that the analysis has on the results can improve predictions and provides insight for interpolating and mapping other climatological normals and averages.
Following her graduation from Carnegie Mellon University, Lauren expects to pursue a doctorate in civil engineering to investigate how energy usage behaviors for heating and cooling homes can reveal economic disparity and the future implications given more extreme weather from climate change.

Lauren Janicke is a 2021 Hollings scholar and civil engineering major at Carnegie Mellon University.


