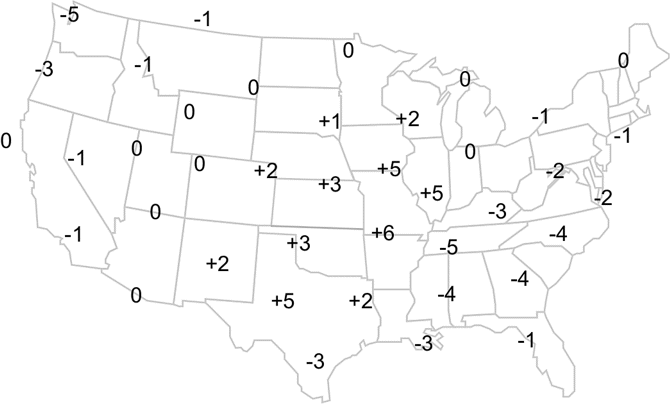
This map shows change in surface pressure (in whole millibars) during the past three hours at various locations.
- Objective
-
Using blue, black, and red colored pencils, you will draw a line connecting equal values of pressure change for every two millibars. These lines are drawn for the -8, -6, -4, -2, 0, +2, +4, +6, +8, etc. values. Remember, like isobars, these lines (called isallobars) are smooth and do not cross each other.
- Procedure
-
Using a blue colored pencil, beginning at any +2 value, lightly draw lines connecting equal values of the +2 millibars pressure change. Remember, you will need to interpolate between values to draw your lines correctly and the lines never cross.
Your map should look like this.
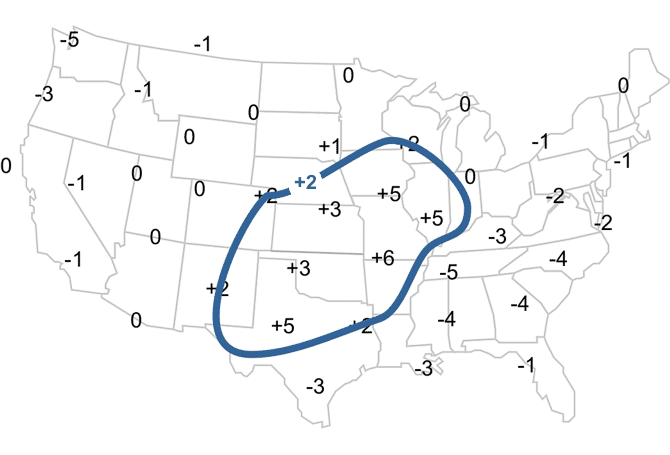
Learning Lesson: Drawing Conclusions - Surface Pressure Change Map Draw the remaining "positive" pressure change value(s) at two millibars intervals.
Your map should look like this.
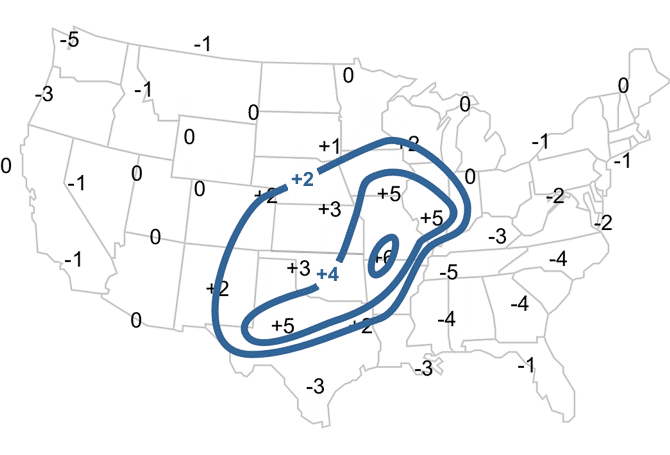
Learning Lesson: Drawing Conclusions - Surface Pressure Change Map Using a black colored pencil, draw a line connecting the zero (0) line. Remember, this line represents where the air pressure is the same as it was three hours previously. The pressure could have risen then fallen, remained steady, or fallen then returned to what was observed three hours previously.
Finally, using a red colored pencil, lightly draw a line connecting equal pressure change values of less than zero (0); the air pressure is lower now than three hours previously.
Your map should look like this.
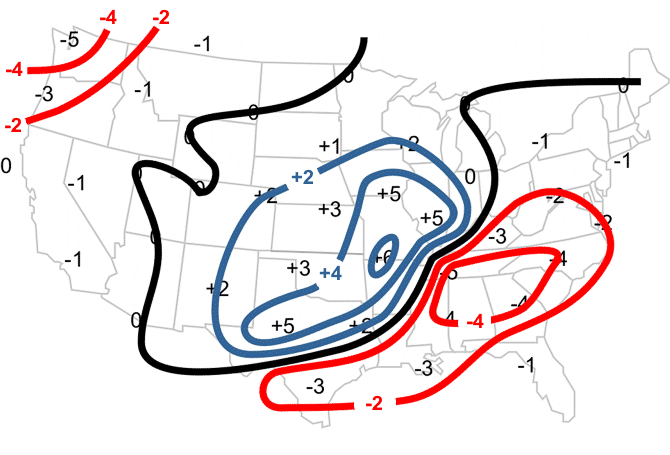 Learning Lesson: Drawing Conclusions - Surface Pressure Change Map
 - Analysis
-
Cold fronts are often located in areas where the pressure change is the greatest. The front represents the boundary of different air masses. Cold air is more dense than warm air, so when a cold front passes your location, the pressure increases. We analyze for pressure change to look for these boundaries. We can also tell where high-pressure and low-pressure systems are moving by looking where the greatest change is occurring.
- Shade in red the region where the surface pressure change is -4 millibars or less.
- Shade in blue the region where the surface pressure change is +4 millibars or more.
Your map should look like this.
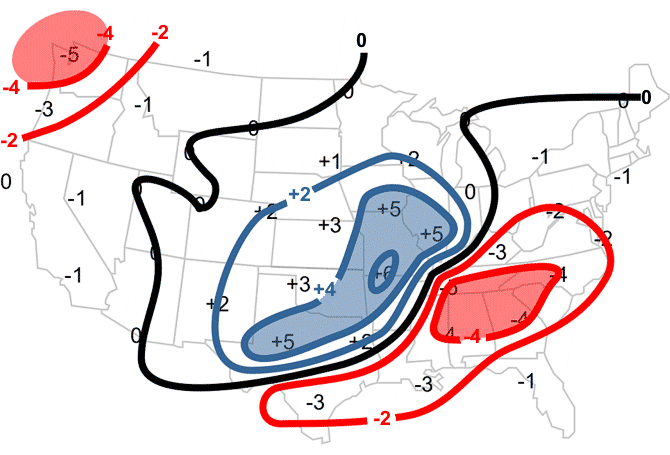
Learning Lesson: Drawing Conclusions - Pressure Change: Completed Analysis

