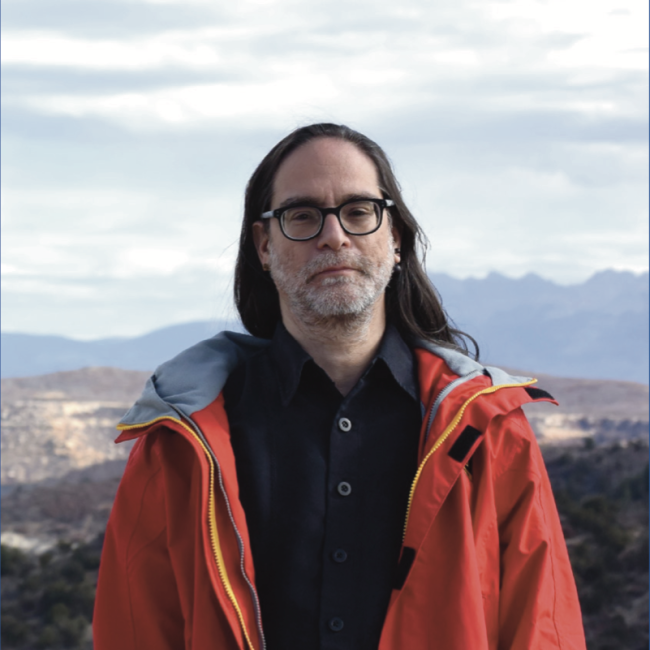
This oral history was conducted by Molly Graham in 2019 as a part of the NOAA 50th Anniversary Oral History Project.

Tenure at NOAA: 1980-present (Image credit: NOAA Heritage)
Tom Wrublewski knows the importance of having every detail in place when it comes to satellites — all the way down to the length of the screws and working light bulbs in the equipment. He has worked on and witnessed many successful satellite launches — and a few unsuccessful — over the course of his 40-year career with NOAA.
Wrublewski has been a physical scientist with NOAA’s National Environmental Satellite, Data and Information Service since 1980, where he initially calibrated, monitored, and tested instruments onboard the Geostationary Operational Environmental Satellites and Polar-orbiting Operational Environmental Satellites. He is currently stationed at the NOAA Joint Polar Satellite System (JPSS) Office at NASA Goddard Space Flight Center.
Hear a snippet of the interview recorded September 26, 2019:
Listen to the full interview with Tom Wrublewski.
Transcript:
On coming to work to NOAA after his teaching career:
TW: Growing up, I went to the University of Maryland, Baltimore campus in Catonsville, Maryland. That’s where I got my bachelor’s degree, which was in geography. I originally started out wanting to be a biology teacher. The science there was pretty rigorous. I took a class in physical geography and had a new teacher that had just come from UCLA [University of California, Los Angeles]. He was a very impressive teacher. Even back then, in the ’70s, was telling us how, in the future, there was going to be more severe storms and more severe weather. He was, I think, ahead of his time and got me more interested in the physical side of geography and climatology and weather.
I became a geography major, while still trying to get the right science credits to be an earth science teacher, instead of a biology teacher. So I got the credits I needed to be an earth science teacher. Then, in the beginning of my career, I was an earth science teacher in Prince George’s County, Maryland. I also took some community college courses, both in Harford County, where I grew up and also here in Prince George’s Country, Maryland, as well as some small courses, like at Howard University, that specialized in microwave remote sensing.
When I was a teacher, I worked my summers for NOAA doing things like their annual inventory down at Suitland, Maryland. After a while, after a few years of working for them during the summers, they asked me what would they need to [do to] convince me to quit teaching and come work for them full-time. Initially, I did take a little bit of a pay cut to come work for the government, but I don’t think it was a bad decision.
My first title at NOAA is still my title; it was a physical scientist, but I was working in the calibration group. We had four people in the group. Two of us worked on the polar-orbiting satellites, and two of us worked on the geostationary satellites, but we had a ten and a half hour workday. So one day a week somebody was off. I would have to cover for that person on their day off. So you learned both jobs. You learned to do the polar side, as well as the geostationary side.
Back then, the geostationary side was basically making a pretty picture for TV. The instrument had eight photomultiplier tubes. You would have to get the calibrations right and normalize the channel so that the picture would look right so you wouldn’t have striping in the picture. That was one of the things I learned. There was a lot of just physics that you were being taught on how infrared and visible channels work. The visible channels are normally what they call linear calibration, and you have two points; you look at space, and you look at a warm point, like inside the instrument, and you draw a straight line between those two points. When you get data that fits on that curve — I call it a curve, but it’s a straight line — then you know what the temperature or what the brightness level if it’s visible, should be. Versus the infrared channels tended to have — they tended to be nonlinear. So when you did the prelaunch calibration, you would have to come up with the equation for the curve, be it a quadratic with a third or fourth or fifth-order polynomial that people would have to come up with this equation that any points that you get in orbit would fit on that curve. You would translate them into the right temperature. That was very interesting work to learn all the physics and science behind that. Some of the instruments weren’t real well-calibrated back then. We were just learning how to do a better job and how to test them at different temperatures.
My job was to primarily — on the TIROS [Television Infrared Observation Satellite] side, we had several instruments. So I would look at summary statistics for how well the instrument did every orbit. This was before we had computers that would automatically plot data. So we would maybe pull points off and manually plot the data to see how things were doing and to see how temperatures would change seasonally or during the course of a week or a month. So it was very interesting for me, and always exciting.


