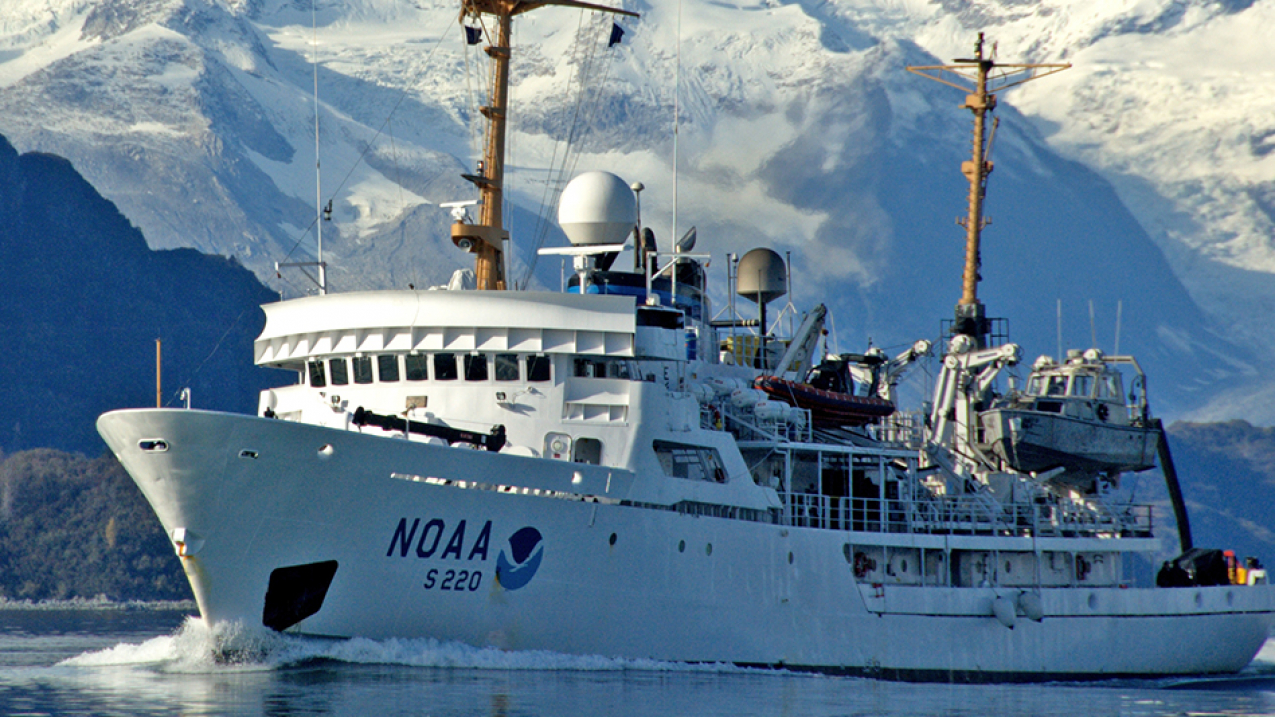
NOAA Ship Fairweather in the Gulf of Alaska with namesake Mt. Fairweather. (Image credit: NOAA)
Arctic charting: Mapping a new frontier
What we know now
Depth matters
It takes more than surveys to build a chart
Putting a plan into action
The Arctic is an international effort
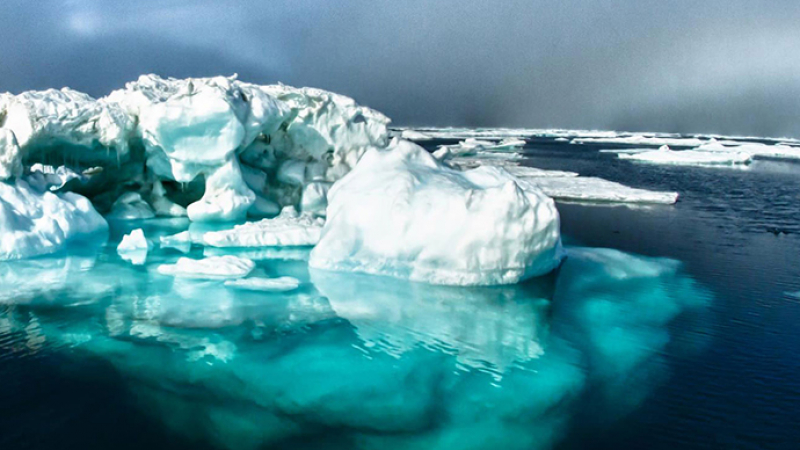
As sea ice we once thought permanent continues to disappear rapidly, Arctic vessel traffic is on the rise. Recent analyses show we can expect to see a nearly ice-free summer at the top of the world by 2040, if not sooner. This is leading to new maritime concerns, especially in those newly emerging areas used by the offshore oil and gas industry, cruise liners, tugs and barges, and fishing vessels. Shrinking sea ice also means expanded maritime navigation possibilities, jurisdictional issues, and the potential for increased pollution and accidents. Keeping all of this new ocean traffic moving smoothly is a growing safety concern. It's also important to the U.S. economy, environment, and national security.
In response to this, NOAA and the U.S. Coast Guard are taking action to promote safe marine operations and transportation in the U.S. Arctic through mapping and charting.
Commercial and recreational vessels depend on NOAA to provide nautical charts and the U.S. Coast Pilot, a series of nautical books, for the latest information on depths, aids to navigation, accurate shorelines, and other features required for safe navigation. NOAA’s more than one thousand charts cover 95,000 miles of shoreline and 3.4 million square nautical miles of waters across the whole nation.
However, many of NOAA’s charts and publications of the U.S. Arctic are inadequate. Until recently, most of the 426,000 square nautical miles of this region was relatively inaccessible by ship due to its thick, impenetrable sea ice. Also, U.S. Arctic waters that are charted were surveyed with imprecise technology dating back to the 1800s, even before the region was part of the United States. Much of the shoreline along Alaska’s northern and western coasts has not been mapped since 1960. As a result, mariners lack confidence in the region’s nautical charts.
Of the 426,000 square nautical miles in the U.S. Arctic Exclusive Economic Zone, NOAA considers 242,000 square nautical miles to be “navigationally significant.” Surveying this with just NOAA hydrographic ships would take decades, so NOAA is reaching beyond its own vessels for data, looking to partnerships and emerging technology to get the job done.
In recent years, NOAA has accelerated its Arctic charting efforts in coordination with the U.S. Coast Guard. The combined effort of NOAA ships, the Coast Guard Icebreaker Healy, and private contractors has resulted in hydrographic surveys to update charts dating back to lead-line surveys of early explorers like Capt. James Cook.
47
—Percent of the 500,000 square nautical miles of U.S. navigationally significant waters in the Arctic.
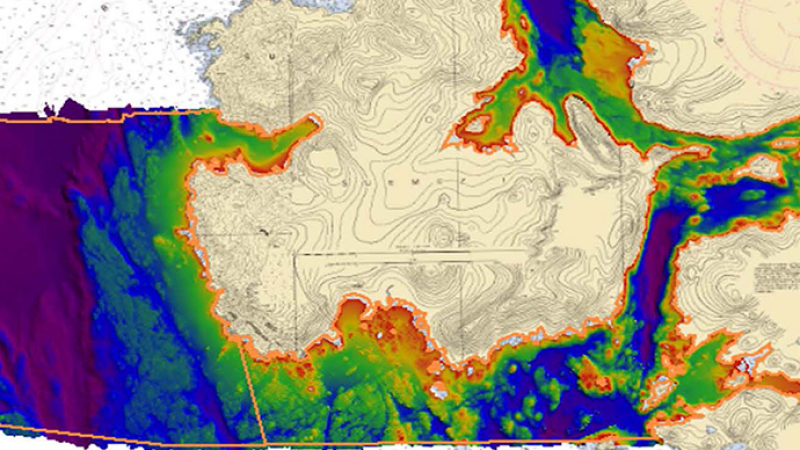
NOAA ships Rainier and Fairweather have been surveying large sections of the maritime routes along the west coast of Alaska. The Healy has supported the effort by acquiring depth measurements in “tracklines,” or straight swaths, while transiting the proposed Bering Strait Port Access Route from Unimak through the Bering Strait. Together, the ships can collect about 12,000 linear nautical miles of data along the four nautical-mile-wide corridor during a single survey season. In addition to measuring depths, they search for seamounts and other underwater dangers to navigation.
NOAA is also evaluating other ways to update and improve U.S. Arctic charts, including the use of satellite images. While these images are not reliable to accurately chart depths, they may indicate seafloor change and identify shallow areas. Additionally, NOAA is leading the establishment of an international database for collecting crowd-sourced data for nautical charting. NOAA has always accepted reports of hazards and chart discrepancies from the public and, in fact, there are more than 2,000 of these reports on our charts today.
Creating nautical charts goes beyond just conducting hydrographic surveys. This region currently lacks the other data needed to build a chart — a geospatial framework to determine the exact location of depth measurements, and tide, current, and water level data to correct depth measurements for the effects of weather and tides.
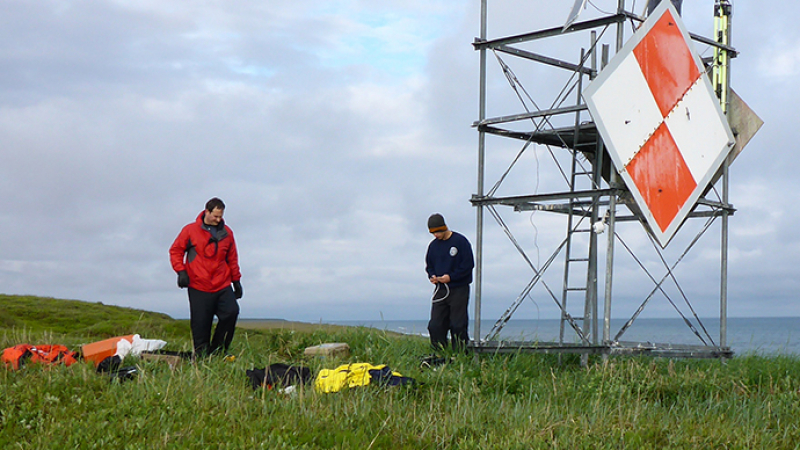
Creating charts and other tools that depict geographic relationships requires a system that describes the location of everything. Many areas of Alaska lack the geospatial foundation needed to fully support marine transportation and maritime awareness. NOAA’s Continuously Operating Reference Stations, a network of more than 1,800 stationary Global Positioning System receivers, are critical for activities requiring precise positioning. NOAA is working with partners to fill in the gaps that exist in Arctic coverage, to improve the precision of survey positions and the measurement of land movement.
Also, we don’t yet have enough data to accurately predict tides, currents, and water levels in the U.S. Arctic. In many Arctic locations, tide and current predictions have never been calculated. For other locations, tide and current predictions have not been updated since the early 1950s when only a few days of data were collected and used to calculate the predictions. Today, NOAA uses at least 30 days of continuous data collection to calculate accurate predictions.
NOAA currently operates nine long-term National Water Level Observation Network tide stations in the Arctic region of Alaska. NOAA has identified areas needing additional stations and is working to strengthen the network in the coming years.
Gaps in these data don’t just affect safe navigation — if an accident does happen, or a search and rescue effort is needed, NOAA’s navigation data is also important for the real-time response.
NOAA nautical charts in the U.S. Arctic currently depict a patchwork of hydrographic surveys which were driven by economic development and national defense in the years before Alaska was even a state. Many charts contain surveyed depths from a hundred years ago, are under-surveyed, or have never been surveyed. Those charts are inadequate for today’s maritime safety.
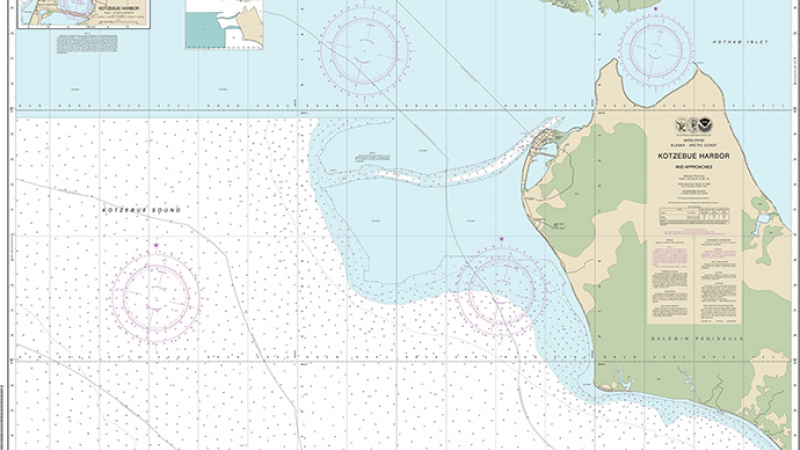
NOAA has issued an U.S. Arctic Nautical Charting Plan after consultations with maritime interests and the public, as well as with other federal, state, and local governments. We’ve completed several new hydrographic surveys and published three new charts (chart 16145, chart 16161 and chart 16190). Now in its third version, the plan provides information about existing, recently added, and proposed new electronic navigational chart coverage in U.S. Arctic waters. Additionally, it provides information about progress on publishing new Arctic charts and specifications for eleven proposed new charts.
In October 2010, NOAA led a U.S. delegation that formally established a new Arctic Regional Hydrographic Commission with four other Arctic nations.
2.5
—Percent of U.S. Arctic that has been surveyed with modern methods and technology.
The commission offsite link, which includes Canada, Denmark, Norway and the Russian Federation, promotes cooperation in hydrographic surveying and nautical charting. The commission provides a forum for better collaboration to ensure safety of life at sea, protect the increasingly fragile Arctic ecosystem, and support the maritime economy.

The commission’s efforts focus on data sharing, new technologies for improved hydrography, resolving duplicative efforts such as overlapping electronic charts, and the development of an Arctic voyage planning guide to aid mariners who plan to transit Arctic waters.
As sea ice we once thought permanent continues to disappear rapidly, Arctic vessel traffic is on the rise. Recent analyses show we can expect to see a nearly ice-free summer at the top of the world by 2040, if not sooner. This is leading to new maritime concerns, especially in those newly emerging areas used by the offshore oil and gas industry, cruise liners, tugs and barges, and fishing vessels. Shrinking sea ice also means expanded maritime navigation possibilities, jurisdictional issues, and the potential for increased pollution and accidents. Keeping all of this new ocean traffic moving smoothly is a growing safety concern. It's also important to the U.S. economy, environment, and national security.
In response to this, NOAA and the U.S. Coast Guard are taking action to promote safe marine operations and transportation in the U.S. Arctic through mapping and charting.

Commercial and recreational vessels depend on NOAA to provide nautical charts and the U.S. Coast Pilot, a series of nautical books, for the latest information on depths, aids to navigation, accurate shorelines, and other features required for safe navigation. NOAA’s more than one thousand charts cover 95,000 miles of shoreline and 3.4 million square nautical miles of waters across the whole nation.
However, many of NOAA’s charts and publications of the U.S. Arctic are inadequate. Until recently, most of the 426,000 square nautical miles of this region was relatively inaccessible by ship due to its thick, impenetrable sea ice. Also, U.S. Arctic waters that are charted were surveyed with imprecise technology dating back to the 1800s, even before the region was part of the United States. Much of the shoreline along Alaska’s northern and western coasts has not been mapped since 1960. As a result, mariners lack confidence in the region’s nautical charts.
Of the 426,000 square nautical miles in the U.S. Arctic Exclusive Economic Zone, NOAA considers 242,000 square nautical miles to be “navigationally significant.” Surveying this with just NOAA hydrographic ships would take decades, so NOAA is reaching beyond its own vessels for data, looking to partnerships and emerging technology to get the job done.
In recent years, NOAA has accelerated its Arctic charting efforts in coordination with the U.S. Coast Guard. The combined effort of NOAA ships, the Coast Guard Icebreaker Healy, and private contractors has resulted in hydrographic surveys to update charts dating back to lead-line surveys of early explorers like Capt. James Cook.

47
—Percent of the 500,000 square nautical miles of U.S. navigationally significant waters in the Arctic.
NOAA ships Rainier and Fairweather have been surveying large sections of the maritime routes along the west coast of Alaska. The Healy has supported the effort by acquiring depth measurements in “tracklines,” or straight swaths, while transiting the proposed Bering Strait Port Access Route from Unimak through the Bering Strait. Together, the ships can collect about 12,000 linear nautical miles of data along the four nautical-mile-wide corridor during a single survey season. In addition to measuring depths, they search for seamounts and other underwater dangers to navigation.
NOAA is also evaluating other ways to update and improve U.S. Arctic charts, including the use of satellite images. While these images are not reliable to accurately chart depths, they may indicate seafloor change and identify shallow areas. Additionally, NOAA is leading the establishment of an international database for collecting crowd-sourced data for nautical charting. NOAA has always accepted reports of hazards and chart discrepancies from the public and, in fact, there are more than 2,000 of these reports on our charts today.
Creating nautical charts goes beyond just conducting hydrographic surveys. This region currently lacks the other data needed to build a chart — a geospatial framework to determine the exact location of depth measurements, and tide, current, and water level data to correct depth measurements for the effects of weather and tides.
Creating charts and other tools that depict geographic relationships requires a system that describes the location of everything. Many areas of Alaska lack the geospatial foundation needed to fully support marine transportation and maritime awareness. NOAA’s Continuously Operating Reference Stations, a network of more than 1,800 stationary Global Positioning System receivers, are critical for activities requiring precise positioning. NOAA is working with partners to fill in the gaps that exist in Arctic coverage, to improve the precision of survey positions and the measurement of land movement.

Also, we don’t yet have enough data to accurately predict tides, currents, and water levels in the U.S. Arctic. In many Arctic locations, tide and current predictions have never been calculated. For other locations, tide and current predictions have not been updated since the early 1950s when only a few days of data were collected and used to calculate the predictions. Today, NOAA uses at least 30 days of continuous data collection to calculate accurate predictions.
NOAA currently operates nine long-term National Water Level Observation Network tide stations in the Arctic region of Alaska. NOAA has identified areas needing additional stations and is working to strengthen the network in the coming years.
Gaps in these data don’t just affect safe navigation — if an accident does happen, or a search and rescue effort is needed, NOAA’s navigation data is also important for the real-time response.
NOAA nautical charts in the U.S. Arctic currently depict a patchwork of hydrographic surveys which were driven by economic development and national defense in the years before Alaska was even a state. Many charts contain surveyed depths from a hundred years ago, are under-surveyed, or have never been surveyed. Those charts are inadequate for today’s maritime safety.
NOAA has issued an U.S. Arctic Nautical Charting Plan after consultations with maritime interests and the public, as well as with other federal, state, and local governments. We’ve completed several new hydrographic surveys and published three new charts (chart 16145, chart 16161 and chart 16190). Now in its third version, the plan provides information about existing, recently added, and proposed new electronic navigational chart coverage in U.S. Arctic waters. Additionally, it provides information about progress on publishing new Arctic charts and specifications for eleven proposed new charts.

In October 2010, NOAA led a U.S. delegation that formally established a new Arctic Regional Hydrographic Commission with four other Arctic nations.
2.5
—Percent of U.S. Arctic that has been surveyed with modern methods and technology.
The commission offsite link, which includes Canada, Denmark, Norway and the Russian Federation, promotes cooperation in hydrographic surveying and nautical charting. The commission provides a forum for better collaboration to ensure safety of life at sea, protect the increasingly fragile Arctic ecosystem, and support the maritime economy.

The commission’s efforts focus on data sharing, new technologies for improved hydrography, resolving duplicative efforts such as overlapping electronic charts, and the development of an Arctic voyage planning guide to aid mariners who plan to transit Arctic waters.


