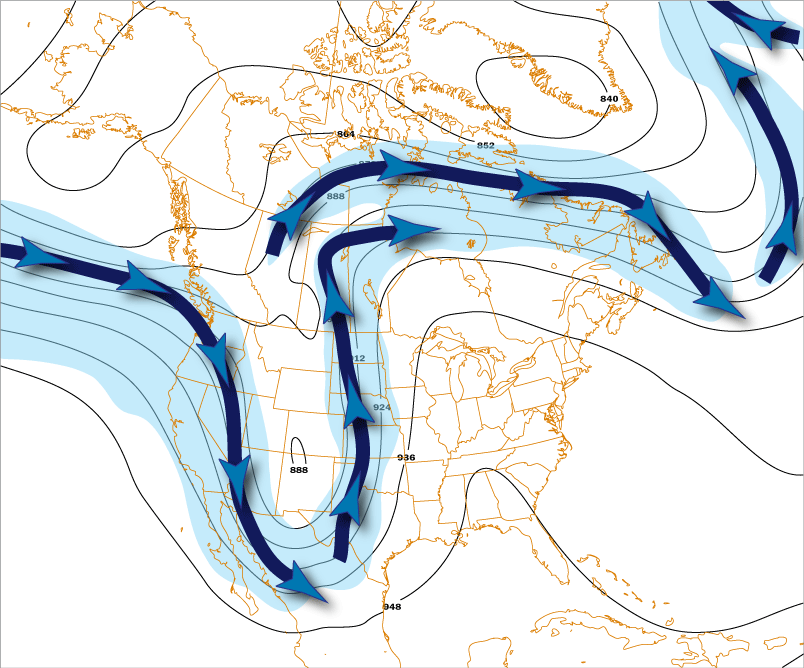
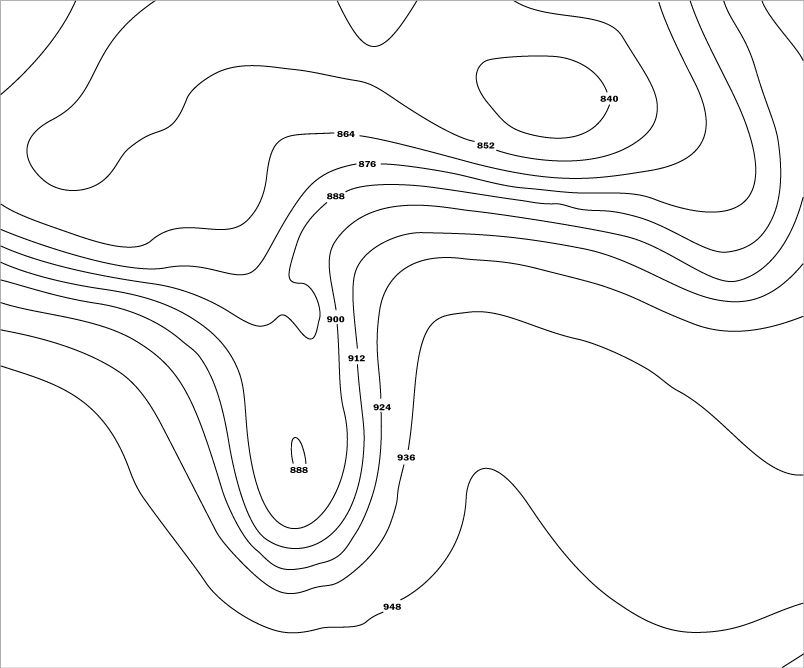
The air pressure everywhere on this map is 300 millibars. The lines represent the height, in meters, of the altitude where the air pressure is 300 mb.
An air pressure of 300 millibars is said to occur near 30,000 feet (9,100 meters) in elevation, but the height ranges from near 27,000 to 32,000 feet (8,200 to 9,600 meters).
For the heights of each 300 mb contour the last digit, 0 (zero), is omitted from the chart. Adding a zero to the end of the four digit height value reveals the actual height in meters. For example, a height value of "912" means the actual height is 9,120 meters (29,921 feet).
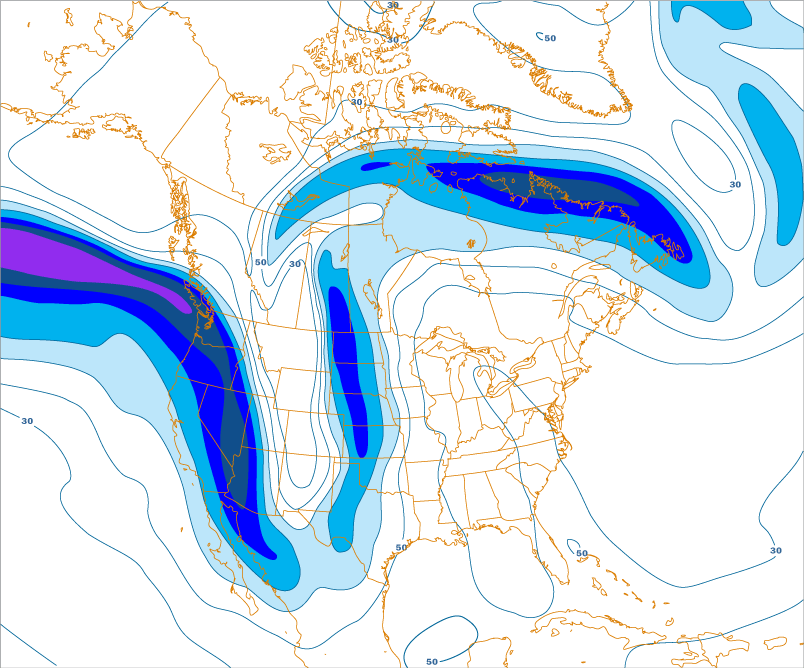
Like the 200 mb chart, this chart is primarily used to locate the jet stream. The jet stream is identified by where the wind speed is 70 kt (81 mph / 130 km/h) or greater (colored shading).
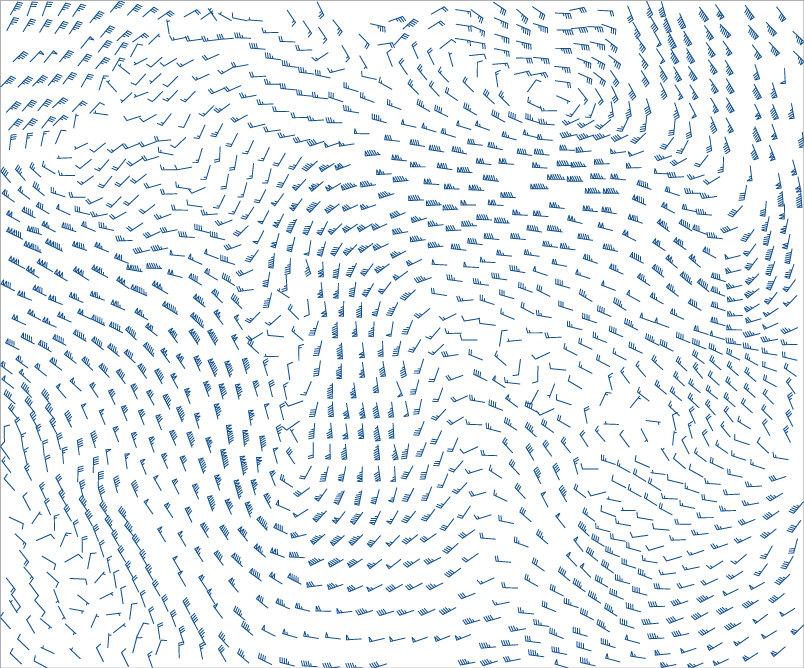
Therefore, contours of equal wind speed (isotachs drawn at 20 kt intervals) are common on this chart. At this altitude, the direction of the wind almost always blows parallel to the contours.
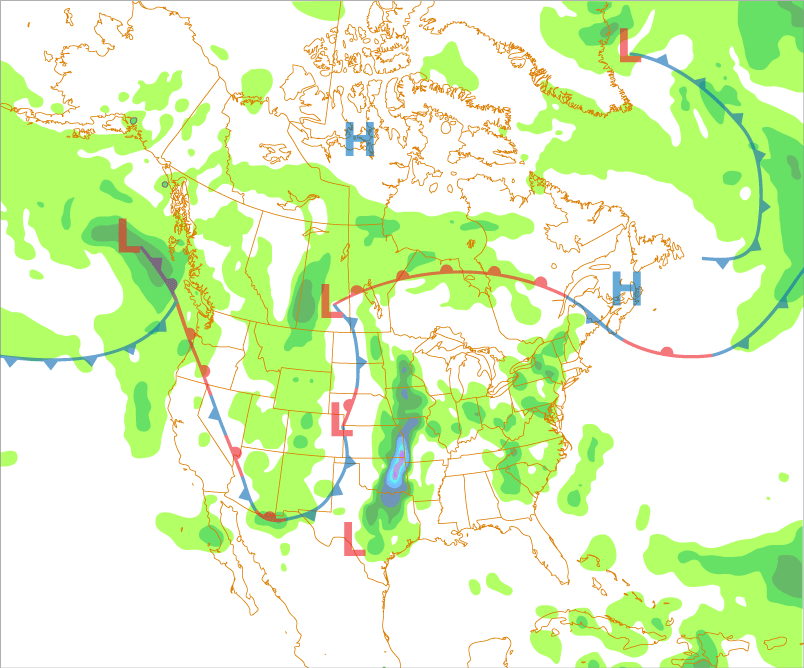
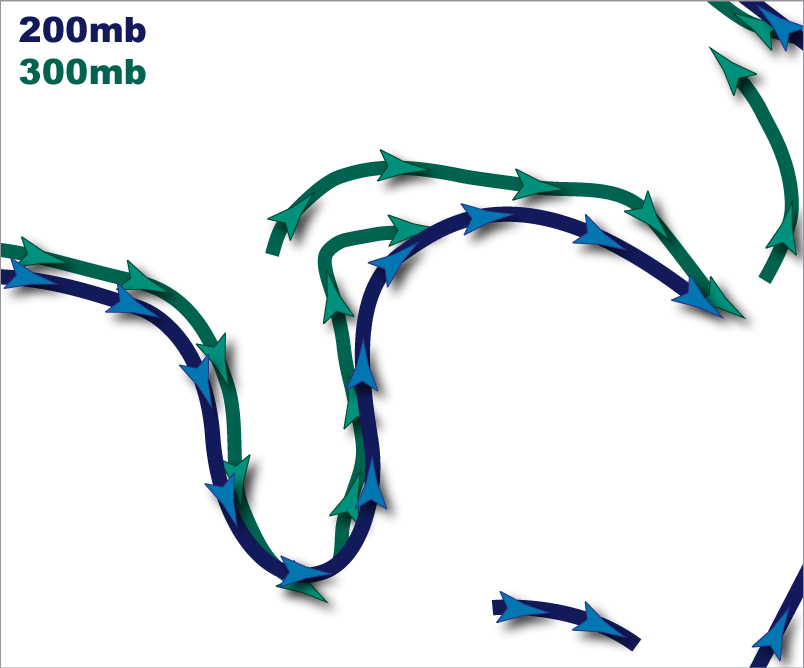
On the map (below), the toggles for wind contours, heights, and barb show what is typically displayed on the 300 mb chart. The toggles for the jet stream and surface weather are for illustrative purposes. The "200 mb vs. 300 mb Jet" toggle compares the location of the jet stream as each level
Note the location of the jet stream at the 300 mb level is typically on the poleward side of the 200 mb position. Also, at 200 mb, the jet stream located in the Gulf of Mexico is the sub-tropical jet stream. It is located at a higher altitude in the atmosphere as compared to the polar jet stream. As such, it is usually not seen at the 300 mb level.