On the 18th anniversary of Tropical Storm Allison, we take a look back at the storm, which brought devastating flooding to parts of Texas
This story, written by Paul Lewis II, originally appeared in Storm Signals Volume 86 in June 2011. Storm Signals was a publication of the Houston/Galveston National Weather Service Forecast Office. We are republishing it as an example of a tropical storm that never reached hurricane-level winds, yet caused extremely heavy flooding in the Gulf region.

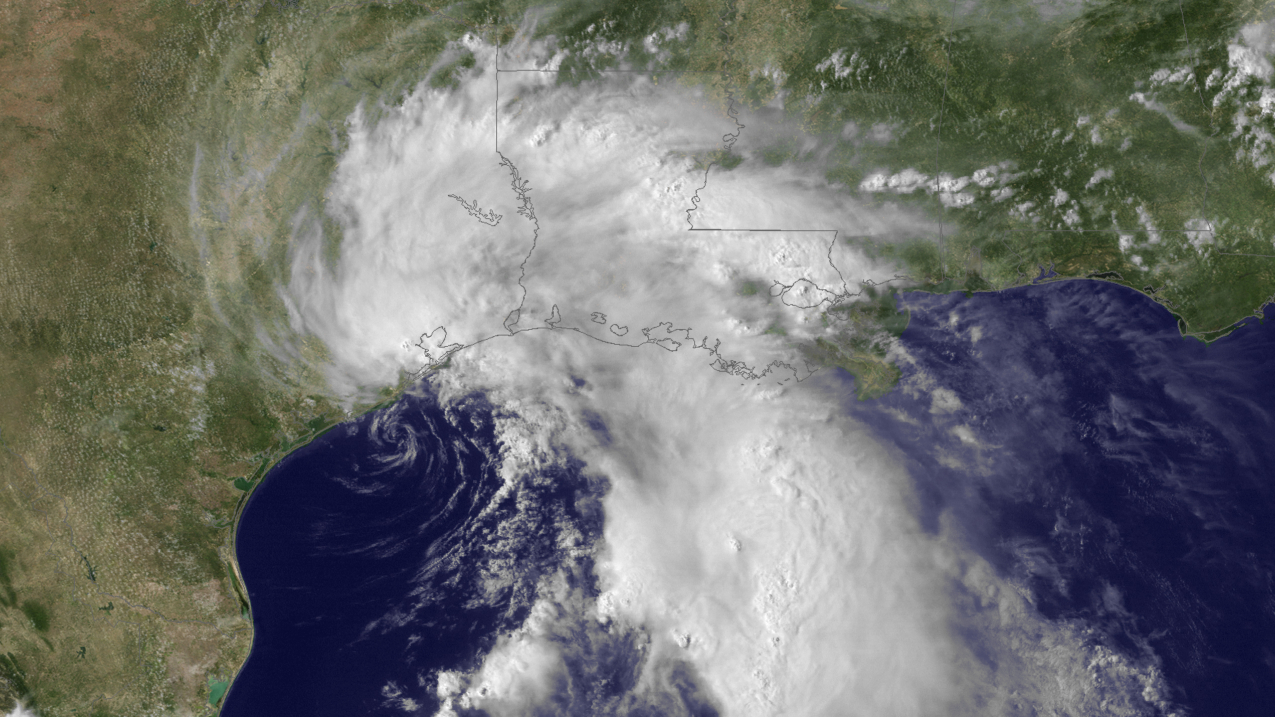
Tropical Storm Allison on June 5, 2001, early in its life, strikes the Gulf coast of Texas and Louisiana. Satellite image is from GOES-8, channel 1 visible mixed with the cloud-free blue marble as background. (Image credit: NOAA/NESDIS)
An unwelcome surprise
Residents of southeastern Texas woke up to an unwelcome surprise on June 5, 2001. A tropical storm had formed and was close to moving onshore along the upper Texas coast. After Allison made landfall, more uninvited events unfolded – four days of heavy rainfall episodes that culminated in devastating flooding across the Houston area. This article is a look back at Allison’s formation, why the storm dumped so much rainfall, and some details on the rainfall and devastating flooding in Texas. To sum things up, we will look at actions you can take to avoid the dangers and minimize the impacts of a devastating flood event.
Allison’s formation
The formation of Tropical Storm Allison can be traced back to a tropical wave. The Tropical Prediction Center began to track the wave on May 21st after it moved off the west coast of Africa. Very little rainfall was associated with this system as it progressed westward and it eventually reached the Gulf of Tehuantepec off the western coast of Mexico on June 1st. A disorganized area of thunderstorms then formed over the Gulf of Mexico as moisture associated with the remnants of the tropical wave interacted with an upper low located over South Texas on June 3rd and 4th. By the morning of Tuesday June 5th, Tropical Storm Allison formed about 140 miles south of Galveston (see figure below for a track of Allison). The storm moved inland later that afternoon, quickly weakened, and became a tropical depression that evening as it drifted inland over Houston. Flooding would accompany Allison over the next four days as the remnants of the storm meandered north to Lufkin, southwest to between Huntsville and College Station, and then south to off the coast near Freeport.

Why did Allison generate so much rainfall?
The devastating flooding from Allison is a stark reminder that rainfall from tropical cyclones does not depend upon the strength of the system. In other words, it does not matter if the tropical cyclone is a tropical depression (with wind speeds up to 38 mph), a tropical storm (winds of 39 to 73 mph), or a hurricane (winds from 74 mph or greater). The Hydrometeorological Prediction Center has found six factors that impact the rainfall potential of landfalling tropical cyclones: the storm track (or movement), time of day, storm size, topography, wind shear, and nearby weather features. Allison was a small storm and the topography of Southeast Texas is rather flat; so, these two factors played a minor role. Between June 5th and the 9th, there was virtually no wind shear and no nearby weather features to affect the storm. The two which then became major factors leading to heavy rainfall over Southeast Texas turned out to be Allison’s slow movement and the time of day. These were aided by an abundance of available Gulf moisture.
Allison’s slow movement after landfall was caused by weak steering currents in the mid and upper atmosphere. On average, the steering currents over Southeast Texas during the tropical season are much weaker than for more northern latitudes. However, these were virtually non-existent while Allison was over Texas because the storm became caught between two centers of high pressure, one to the east and the other to the west. This caused the storm to do a slow counterclockwise loop similar to what a spinning top would do on a flat surface. Allison finally moved away from the state only after the eastern high pressure area became more dominant and generated westerly flow aloft.
The time of day factor played a major role during Allison’s meandering over Texas. In general, the heavy rainfall area in a tropical cyclone over land tends to become concentrated closer to the center of the storm during the night and early morning. This phenomenon is known as a core rain event. As the day progresses, the core rain area then has a tendency to dissipate with the heavy rainfall becoming more concentrated into one or more bands well away from the storm’s center. These rain bands then lose dominance and contract back into a core rain area toward the storm’s center during the evening. Because of Allison’s slow movement and its daily rain band and core rain process, some communities in Southeast Texas experienced repeated episodes of flooding rainfall.

Allison’s rainfall and flooding
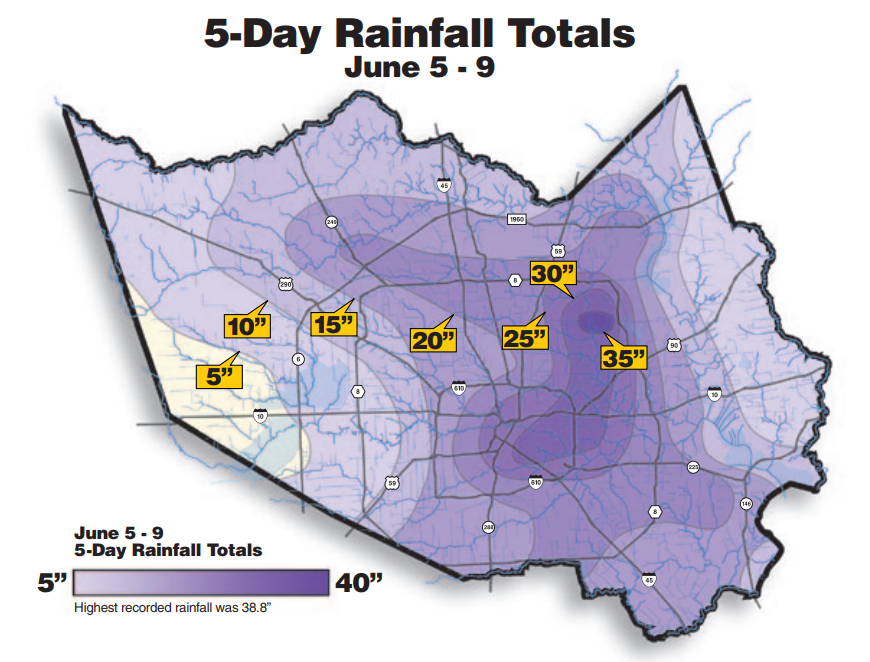
An incredible amount of rain fell across Southeast and East Texas during the five day period ending on June 10, 2001 (see rainfall images below and Tables 1 and 2 at the end of the story for specific data). The highest amounts measured were just over 38 inches. Even though there was widespread flooding during the first three days of the event, no flood-related deaths were reported. However, 22 deaths occurred during flooding caused by the extreme rainfall that fell across Houston on the 8th and 9th. Of those, 19 were related to driving or walking through flood waters.

The first significant flood event associated with Allison occurred during landfall on June 5th. A large spiral band moved inland and caused widespread street flooding and some flooding of homes across northern Galveston and eastern Harris Counties. On the 6th and 7th, a core rain area affected locations to the north of Houston and rain bands dropped heavy rain to the south and east. Nearly continuous moderate rainfall over this two-day period resulted in flooding between Conroe and Crockett. Early on Thursday morning the 7th, a heavy rain band that extended from near Beaumont westward into Sugar Land caused flooding of roadways and homes in the Sugar Land and Stafford areas. Late on Thursday into early Friday, another rain band dropped nearly 12 inches of rainfall in and around the towns of Freeport and Brazoria.

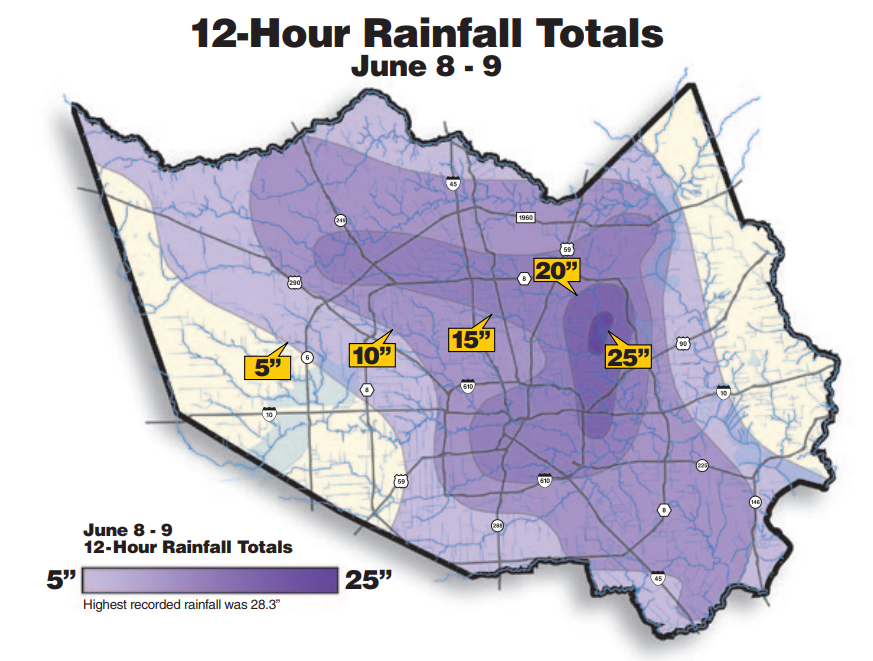
Houston then experienced significant flooding late Friday the 8th into early Saturday the 9th as a core rain event occurred just east of Allison’s center. Much of Friday was actually sunny over the city. The resulting abundance of daytime heating combined with the excessive tropical moisture enhanced the dangerous flood potential. This potential became manifest by the midafternoon as rain bands developed and moved northward from the coast. The bands fed into a rain area that was moving southward into Montgomery County. The resulting core rainfall produced incredible totals over Harris County later that night. Additional flooding occurred along the coast Saturday morning before the rain finally ended.
The two-day rainfall totals across Harris County ranged from almost 1 inch in the extreme west at Katy to in excess of 26 inches over Green’s Bayou in the east (see image below). Heavy rainfall was observed for up to 10 hours in some locations. Flooding became widespread and major freeways experienced severe flooding, especially in locations where the freeway was built to below ground level. In two vivid examples, water levels rose to just below the overpasses on Interstate 10 just north of the Uptown district and on US Highway 59 just west of the Downtown district. In all, the severe flooding across the Houston metropolitan area in Harris County affected more than 2 million people.

| Location | County | Rainfall (inches) |
|---|---|---|
|
Port of Houston |
Harris | 36.99 |
| Pennington | Houston | 15.60 |
| Beaumont Research | Jefferson | 27.24 |
| Huntsville | Walker | 13.01 |
| Pearland Clover Field | Brazoria | 21.41 |
| Houston Hobby Airport | Harris | 20.84 |
| Segno | Polk | 12.99 |
| Deer Park | Harris | 20.50 |
| Sugarland AIrport | Fort Bend | 12.17 |
| Westbury | Harris | 19.53 |
| Newton | Newton | 12.08 |
| League City, NWS | Galveston | 19.41 |
| Alvin | Brazoria | 11.23 |
| Conroe | Montgomery | 17.48 |
| Baytown | Harris | 9.83 |
| Bush Intercontinental | Harris | 16.48 |
| Galveston | Galveston | 9.77 |
| Tomball Hooks Airport | Harris | 15.02 |
| Gage | Location | Rainfall (Inches) |
|---|---|---|
| Greens Bayou | Mt. Houston Pkwy | 38.78 |
| Garners Bayou | Beltway 8 | 24.72 |
| Hunting Bayou | I-10 | 35.83 |
| Buffalo Bayou | Turning Basin | 22.91 |
| Greens Bayou | Ley Road | 33.66 |
| Clear Creek | Telephone Road | 22.56 |
| Cowart Creek | Baker (Friendswood) | 28.31 |
| Greens Bayou | Bammel N Houston | 20.39 |
| Vince Bayou | West Ellaine | 26.85 |
| Brays Bayou | Stella Link | 19.76 |
| Hunting Bayou | Lockwood | 25.12 |
| Buffalo Creek | Milam | 16.02 |


