In the past dozen years, there have been six major tsunamis around the world which resulted in nearly a quarter million deaths and over $260 billion in property damage. Each of these tsunamis focused global attention on the threat and significant impacts of these catastrophic events. In the United States, the potential for tsunamis is most prevalent in the Hawaii and the surrounding Ring of Fire. In fact, more people have died in Hawai‘i from tsunamis than from hurricanes, floods, and volcanoes combined, making it the state’s deadliest natural hazard.

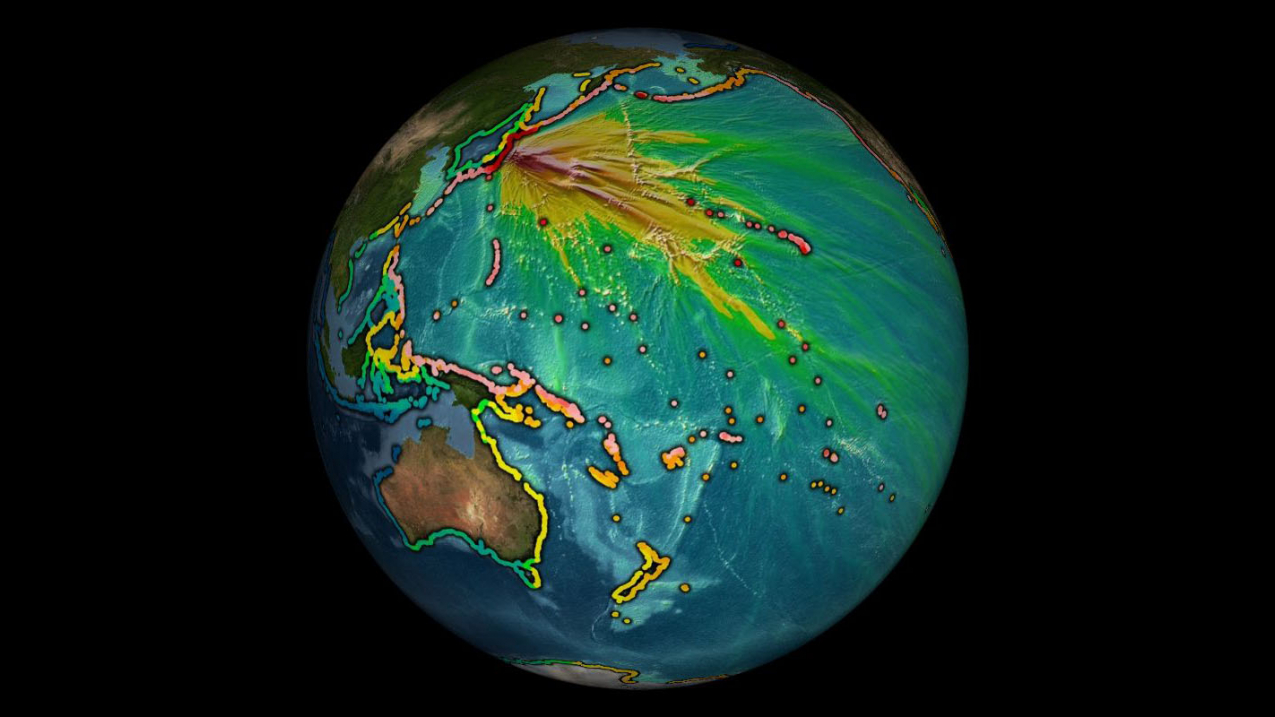
This tsunami was generated by the 9.0 magnitude earthquake off the Pacific coast of Japan on March 11, 2011 along a 300 km or 180 mile long megathrust fault. The wave "energy map" of maximum wave heights show that those coastlines directly in the energy "beam" of red/yellow had a much higher impact than those to either side of it. (Image credit: NOAA)
Tsunami education plays a critical role when taking steps towards increasing the resilience of coastal communities around the world. Coastal communities need to understand the hazards tsunamis pose not only to know what to do when a tsunami warning is issued, but in the worst cases they need to know what to do before any tsunami warning can be given when the tsunami forms from a nearby earthquake. However, tsunami science is complex and difficult to visualize, as the effects of these phenomena are multifaceted and yield far reaching consequences. NOAA’s Science On a Sphere® (SOS) is a powerful visualization tool and an ideal medium for showcasing the truly global impact of tsunamis. To adapt this tool for tsunami education, NOAA’s Pacific Tsunami Warning Center and Office for Coastal Management in Hawaii have developed intuitive visualizations that show viewers the impact of a tsunami in an easy way to understand.

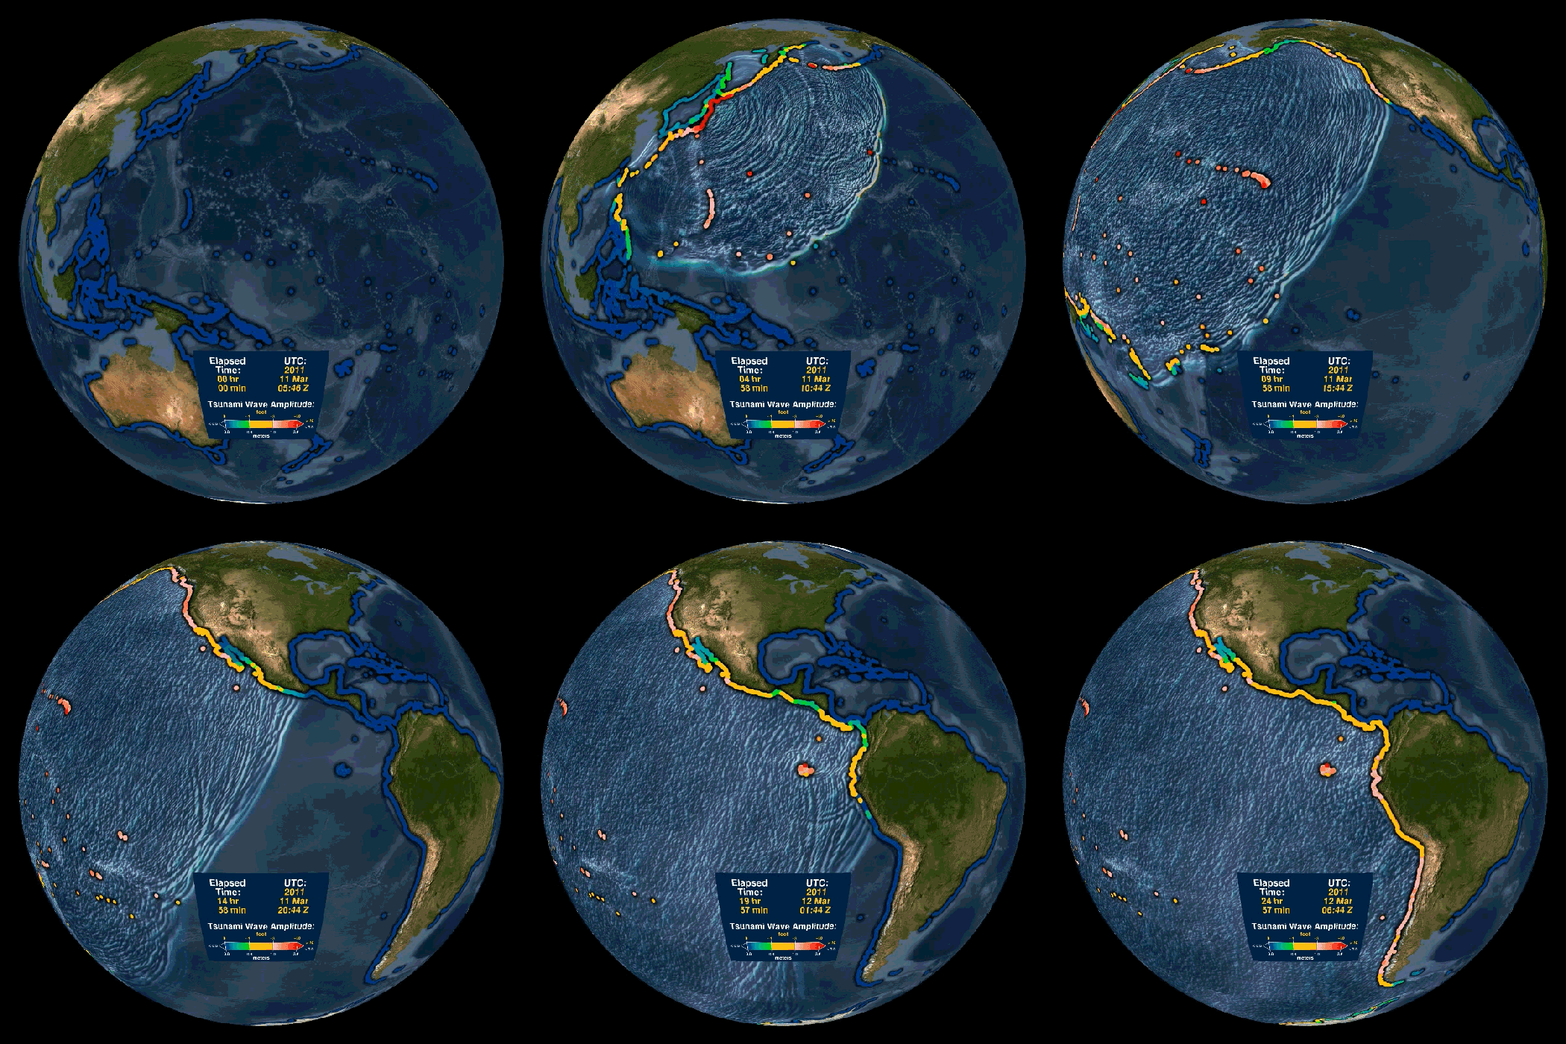
The Pacific Tsunami Warning Center and Office for Coastal Management are creating a suite of historical and real-time tsunami animations. In the past, visualizations did not necessarily show coastal impacts and each one used a different color scheme, making it difficult to compare the severity of different tsunamis. This new series of animations also show what happens when tsunami waves strike land, the same information that Pacific Tsunami Warning Center uses to issue tsunami hazard guidance for impacted coastlines. In addition, the wave height color scheme is based on Pacific Tsunami Warning Center’s warning criteria and is consistently applied across all of these animations thus allowing for easy comparisons between tsunamis. This set of animations also serves as a ready-made template that NOAA scientists can use to visualize new tsunamis — faster, easier, and more intuitively.
SOS tsunami animations help to unravel the complexity of tsunami science through a stunning visual experience. Tsunami animations have been distributed to over 100 SOS locations throughout the world, serving over 33 million visitors annually. To meet the needs of those unable to view an SOS, the animations are also distributed via the Pacific Tsunami Warning Center’s YouTube channel, which have garnered over 360,000 hits in less than six months. Furthermore, OCM and PTWC designed these historical tsunami visualizations so that they could be used to provide context during a real-time event.
This story was provided by NOAA's Office for Coastal Management, a member of the NOAA Education Council, as part of our ongoing effort to share education accomplishments from across NOAA. For more information, you can learn the Tsunami Aware evacuation routes for Hawaii and Guam, explore historical tsunami datasets on the Science On a Sphere website, or visit NOAA's Science On a Sphere at an institution near you.


